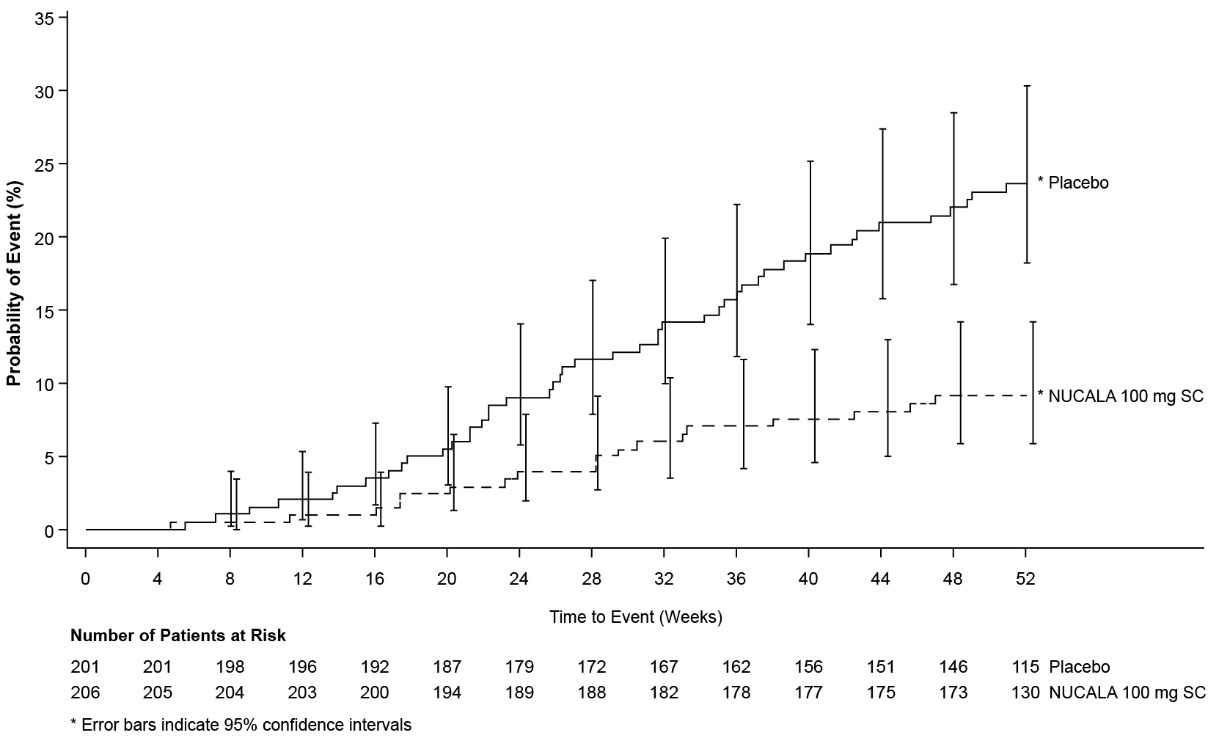
Figure 1. Kaplan-meier Cumulative Incidence Curve For Time To First Exacerbation (trial 2) (Nucala Spl Graphic 01)
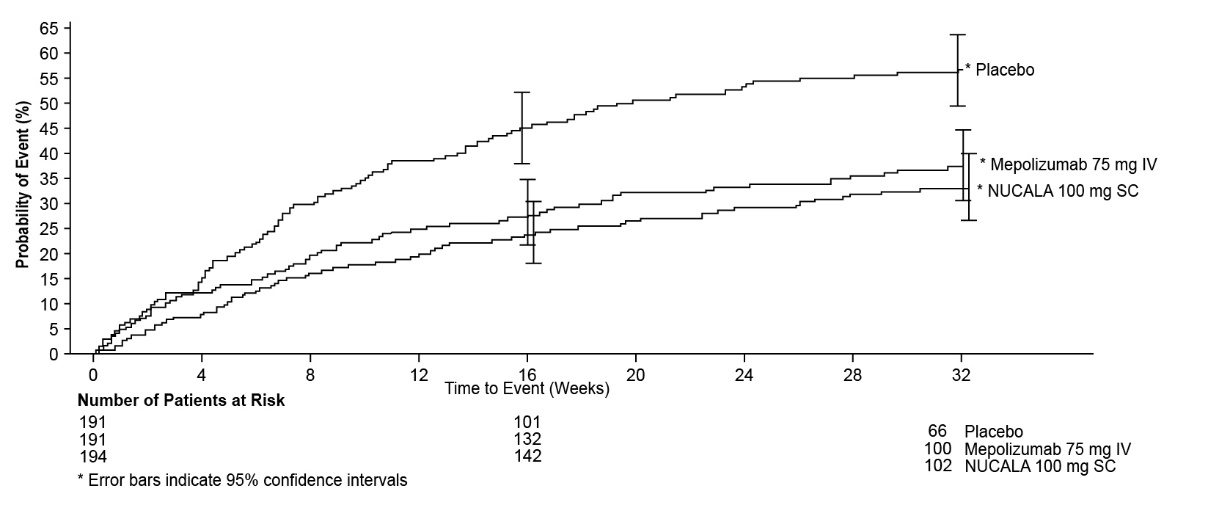
This appears to be a graph displaying the probability of an event for different treatments over a period of weeks. The treatments include a placebo, Mepolizumab 75 mg IV, and NUCALA 100 mg SC. The graph also indicates the number of patients at risk and the number of events occurring over the weeks. There are error bars indicating 95% confidence intervals.*