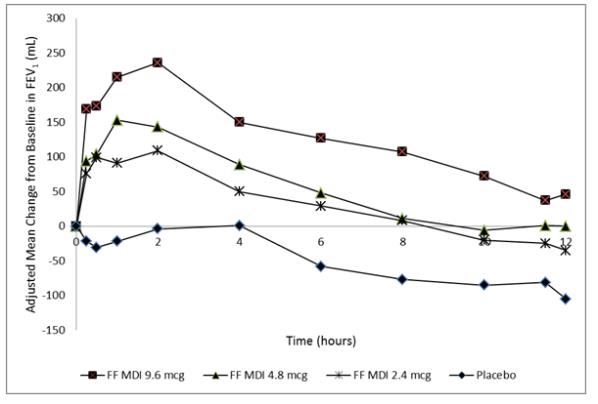
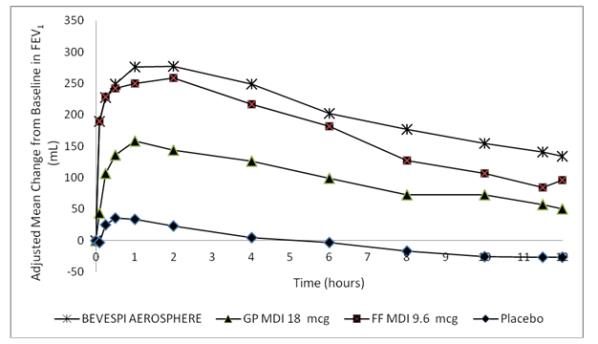
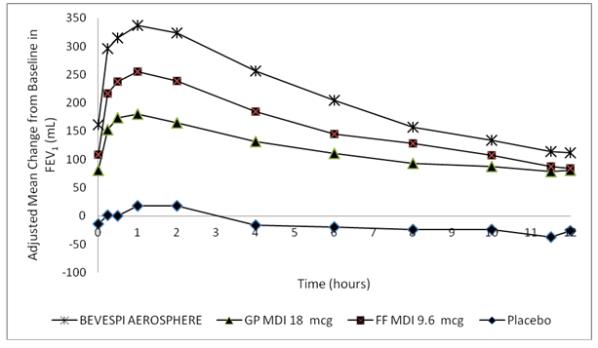
Figure 1 (Mean Change from Baseline in FEV1 over Time on Day 14 (MITT Population))
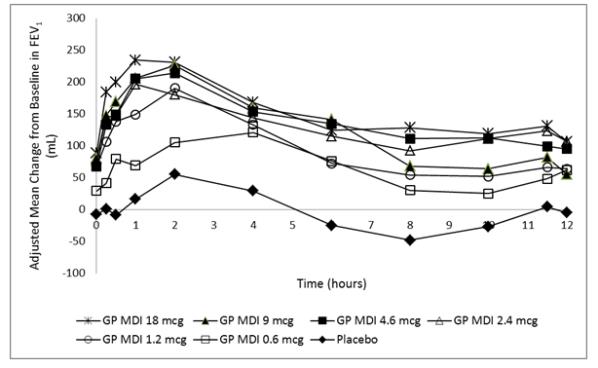
This data presents the adjusted mean change from baseline in FEV over time (in hours) for various dosages and types of inhalers (GP MDI 18mcg, GP MDI 9mcg, GP MDI 4.6 mcg, GP MDI 24 mcg, GP MDI 1.2 mcg, GP MDI 0.6 mcg, and Placebo).*