Liraglutide Injection
Product Images NDC 0480-3667

View Photos of Packaging, Regulatory Labels, and Product Appearance

Product Visual Gallery

This gallery contains 35 technical images submitted to the FDA as part of the official labeling for Liraglutide (NDC 0480-3667). Unlike standard consumer photos, these assets often include clinical data figures, molecular chemical structures, and official manufacturer packaging layouts.

As provided by Teva Pharmaceuticals Usa, Inc., these visuals offer a comprehensive scientific overview of the product's physical and chemical identity, aiding pharmacists and researchers in product verification and study.

FDA Label Image

Carton_2_pens (Carton 2 Pens)

Carton_2_pens (Carton 2 Pens)
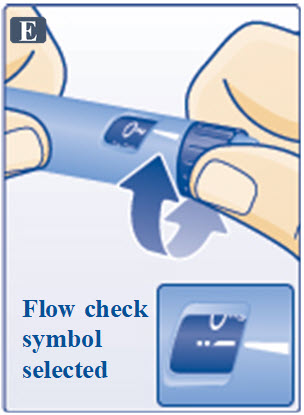
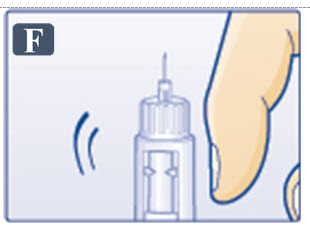
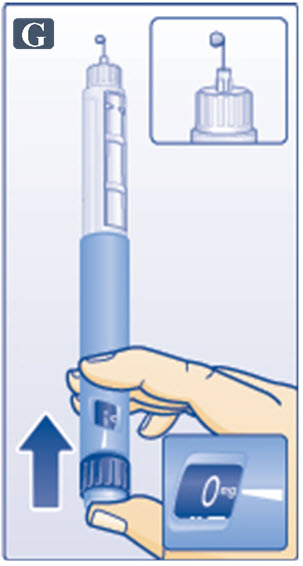
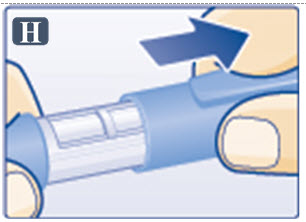
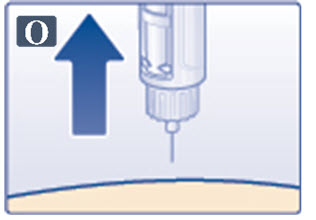
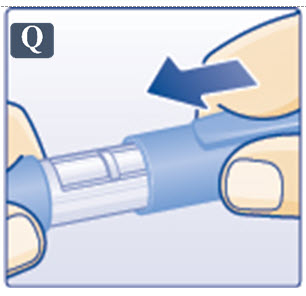
This text provides detailed information about Liraglutide injection, which is administered subcutaneously under the direction of a healthcare professional. It contains 18 mg/3 mL (6 mg/mL) of liraglutide as the active ingredient, along with various inactive ingredients. The medication is available in a prefilled pen, which can deliver different doses. It should be refrigerated and not frozen. The product is not child-resistant, and if the seal is broken, the pharmacist should be contacted. The manufacturer is Teva Pharmaceuticals in the US and Novo Nordisk in Denmark. Each pen is for single-patient use only and should be discarded after 30 days. Additional details include product literature, disposal instructions, and relevant identification codes.*
FDA Label Image

Carton_3_pens (Carton 3 Pens)

Carton_3_pens (Carton 3 Pens)
This text describes a medication called Liraglutide injection, which is provided in prefilled pens containing 18 mg/3 mL (6 mg/mL). It is for subcutaneous use only and each pen is intended for single-patient use. The medication contains liraglutide 6mg per mL along with inactive ingredients. It is important to refrigerate the pens and not freeze them. After the first use, they should be stored at a temperature not exceeding 86°F (30°C). The product should not be transferred to a syringe, and each pen can deliver multiple doses of 0.6 mg, 1.2 mg, or 1.8 mg. Additionally, it mentions details for contacting Teva Pharmaceuticals and Novo Nordisk A/S for manufacturing information.*
FDA Label Image

Figure-1 (Figure 1)

FDA Label Image

Figure-2 (Figure 2)

Figure-2 (Figure 2)
This is a graph showing the comparison of ISR (pmol/kg/min), Liraglutide, and Placebo based on plasma glucose levels (mg/dL). The x-axis represents plasma glucose levels ranging from 80 to 220 mg/dL, while the y-axis indicates ISR values in pmol/kg/min. The data points show how ISR changes in response to Liraglutide and Placebo across different plasma glucose concentrations.*
FDA Label Image

Figure_3 (Figure 3)

Figure_3 (Figure 3)
This text appears to be a numerical data showing doses of Glimepiride, Liraglutide 1.2 mg, and Liraglutide 1.8 mg over a period of time (weeks). The graph probably depicts the medication dosage changes and their effects over time.*
FDA Label Image

Figure_4 (Figure 4)

Figure_4 (Figure 4)
This text appears to be outlining measurements of Mean HbA (%) over time, with data points for different medications or dosages such as Liraglutide 1.2 mg, Liraglutide 1.8 mg, and Sitagliptin 100 mg. The measurements are taken at various time points ranging from 0 to 26 weeks. This data is likely part of a study or analysis related to managing or monitoring HbA levels in patients. It provides a visual representation of how these medications may impact Mean HbA (%) levels over time.*
FDA Label Image

Figure-5 (Figure 5)

FDA Label Image

Pen_image (Image 01)

FDA Label Image

Injection-pen (Image 22)

Injection-pen (Image 22)
Description not available.*
FDA Label Image

Needle-example (Image 23)

Needle-example (Image 23)
A description of a needle with outer and inner parts, including protective cap and needle tab for safety.*
FDA Label Image

Triangle_1 (Image 24)

FDA Label Image

Triangle_2 (Image 25)

FDA Label Image

Triangle_3 (Image 26)

FDA Label Image

Tirangle_4 (Image 27)

FDA Label Image

Triangle_5 (Image 28)

FDA Label Image

Triangle_6 (Image 29)

FDA Label Image

Tirangle_7 (Image 30)

FDA Label Image

Triangle_8 (Image 31)

FDA Label Image

Image-a (Image 32)

FDA Label Image

Image-b (Image 33)

FDA Label Image

Image-c (Image 34)

FDA Label Image

Image-d (Image 35)

FDA Label Image

Image-e (Image 36)

FDA Label Image

Image-f (Image 37)

FDA Label Image

Image-g (Image 38)

FDA Label Image

Image-h (Image 39)

FDA Label Image

Image-i (Image 40)

FDA Label Image

Image-j (Image 41)

FDA Label Image

Image-k (Image 42)

FDA Label Image

Image-l (Image 43)

FDA Label Image

Image-m (Image 44)

FDA Label Image

Image-n (Image 45)

FDA Label Image

Image-o (Image 46)

FDA Label Image

Image-p (Image 47)

FDA Label Image

Image-q (Image 48)

* These product label images have been analyzed using experimental machine learning. Please verify findings with the primary label text.