Chart Image (Plavix 75mg Chart)

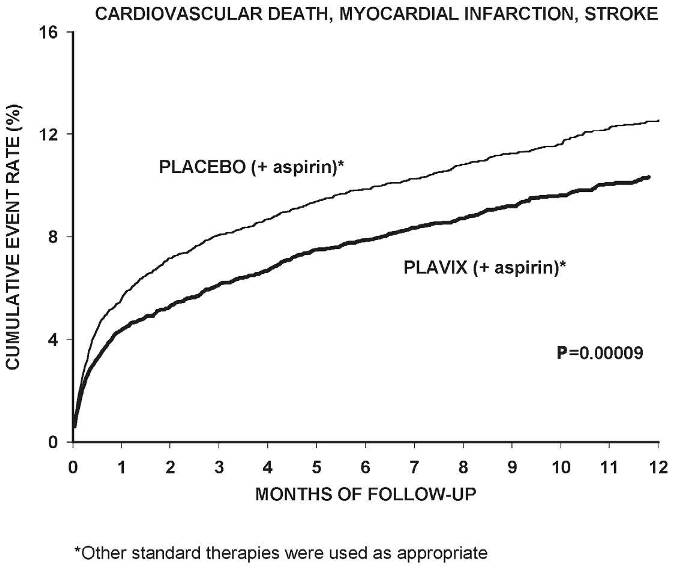
This is a graph displaying the cumulative event rate in percentage for either faial or non-faial vascular events over a period of 36 months of follow-up. The graph compares the use of aspirin versus Plavix. The data points for each medication are given at the 12, 18, 24, 30, and 36-month follow-up intervals.*