Exelon
Product Images NDC 21695-357

11 FDA label images from Rebel Distributors Corp · Packaging, Regulatory Labels, and Product Appearance

Product Visual Gallery

This gallery contains 11 technical images submitted to the FDA as part of the official labeling for Exelon (NDC 21695-357). Unlike standard consumer photos, these assets often include clinical data figures, molecular chemical structures, and official manufacturer packaging layouts.

As provided by Rebel Distributors Corp, these visuals offer a comprehensive scientific overview of the product's physical and chemical identity, aiding pharmacists and researchers in product verification and study.

FDA Label Image

Image Of Chemical Structure (5d7c4d41 2df4 42d4 9a3d 0a567519bf2d 01)
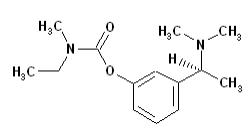
Image Of Chemical Structure (5d7c4d41 2df4 42d4 9a3d 0a567519bf2d 01)
Chemical structure of the active ingredient in Exelon, showing a molecular diagram with various functional groups attached to a benzene ring and nitrogen-containing substituents.*
FDA Label Image

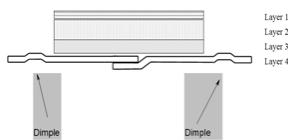
Image Of Figure 1 (5d7c4d41 2df4 42d4 9a3d 0a567519bf2d 02)

Image Of Figure 1 (5d7c4d41 2df4 42d4 9a3d 0a567519bf2d 02)
An instructional diagram showing a cross-sectional view of a multi-layer structure labeled with Layer 1 through Layer 4. It highlights the presence of dimples on two opposite sides of the structure, indicated by arrows pointing to the dimples.*
FDA Label Image

Image Of Figure 2 (5d7c4d41 2df4 42d4 9a3d 0a567519bf2d 03)

Image Of Figure 2 (5d7c4d41 2df4 42d4 9a3d 0a567519bf2d 03)
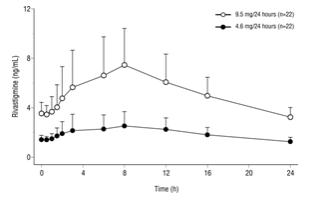
A line graph depicting plasma concentration (ng/mL) over 24 hours for two groups receiving doses of 8.5 mg/24 hours and 4.6 mg/24 hours. Time in hours is shown on the x-axis, with measurements at multiple time points up to 24 hours. The 8.5 mg/24 hours group shows higher plasma concentrations than the 4.6 mg/24 hours group, with error bars indicating variability in each measurement.*
FDA Label Image

Image Of Figure 3 (5d7c4d41 2df4 42d4 9a3d 0a567519bf2d 04)

Image Of Figure 3 (5d7c4d41 2df4 42d4 9a3d 0a567519bf2d 04)
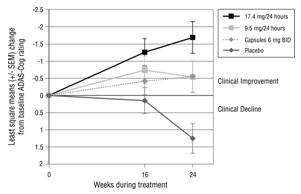
A line graph depicting Least Square means plus SEM changes from baseline ADAS-cog scores over 24 weeks of treatment. Four groups are shown: 17.4 mg/24 hours, 9.5 mg/24 hours, Capsules 6 mg BID, and Placebo. The graph illustrates clinical improvement or decline trends during the treatment period.*
FDA Label Image

Image Of Figure 4 (5d7c4d41 2df4 42d4 9a3d 0a567519bf2d 05)

Image Of Figure 4 (5d7c4d41 2df4 42d4 9a3d 0a567519bf2d 05)
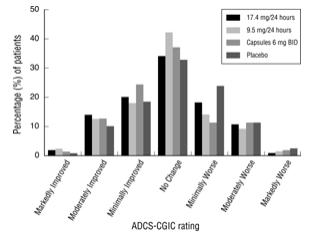
A bar chart depicting the distribution of ADCS-CGIC ratings among patients in different treatment groups including 17.4 mg/24 hours, 9.5 mg/24 hours, Capsules 6 mg BID, and Placebo. The chart shows the percentage of patients rated as markedly improved, moderately improved, minimally improved, no change, minimally worse, moderately worse, and markedly worse.*
FDA Label Image

Image Of Where To Apply (5d7c4d41 2df4 42d4 9a3d 0a567519bf2d 06)

Image Of Where To Apply (5d7c4d41 2df4 42d4 9a3d 0a567519bf2d 06)
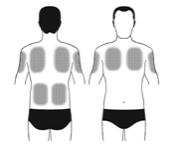
Illustration showing shaded areas on front and back upper body, highlighting locations on the shoulders and upper back. The image depicts anatomical zones, possibly for topical application or treatment areas.*
FDA Label Image

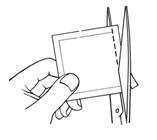
Image Of How To Apply (5d7c4d41 2df4 42d4 9a3d 0a567519bf2d 07)

Image Of How To Apply (5d7c4d41 2df4 42d4 9a3d 0a567519bf2d 07)
An instructional black-and-white line drawing showing a hand holding a small packet while scissors cut along a dotted line on the packet's edge, suggesting opening the packet as part of product usage instructions.*
FDA Label Image

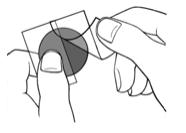
Image Of Protective Liner (5d7c4d41 2df4 42d4 9a3d 0a567519bf2d 08)

Image Of Protective Liner (5d7c4d41 2df4 42d4 9a3d 0a567519bf2d 08)
An instructional illustration showing a person's hands peeling back a protective film from a circular adhesive patch. The image demonstrates how to handle and prepare the patch for application.*
FDA Label Image

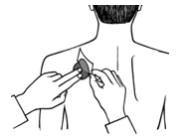
Image Of Sticky Side (5d7c4d41 2df4 42d4 9a3d 0a567519bf2d 09)

Image Of Sticky Side (5d7c4d41 2df4 42d4 9a3d 0a567519bf2d 09)
An instructional illustration showing the application of a patch to the upper back area. The image depicts a person seen from behind while another hand peels and places the patch on the skin.*
FDA Label Image

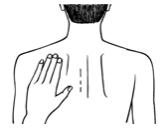
Image Of Press Firmly (5d7c4d41 2df4 42d4 9a3d 0a567519bf2d 10)

Image Of Press Firmly (5d7c4d41 2df4 42d4 9a3d 0a567519bf2d 10)
An instructional illustration depicting a person tapping their upper back with the side of their hand. The image shows the upper back from behind, indicating a technique likely related to a medical or therapeutic procedure.*
FDA Label Image

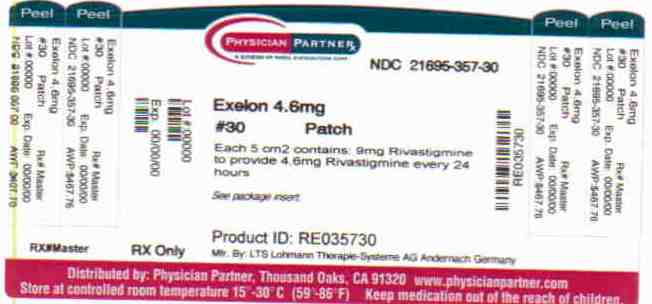
Exelon 4.6mg (5d7c4d41 2df4 42d4 9a3d 0a567519bf2d 11)

Exelon 4.6mg (5d7c4d41 2df4 42d4 9a3d 0a567519bf2d 11)
Exelon 4.6 mg patch packaging label showing 30 patches per package. Distributed by Physician Partner, Thousand Oaks, CA 91320. The label states each 5 cm2 patch contains 9 mg Rivastigmine to provide 4.6 mg every 24 hours. Includes product ID RE035730 and NDC 21695-357-30 with storage instructions and prescription-only status.*

* About these descriptions: Image descriptions on this page are generated by automated AI analysis of the product label images from the manufacturer's FDA label submission (SPL). They are provided for reference only and may contain errors or omissions. Always rely on the printed label itself and the official FDA labeling, and consult a pharmacist or healthcare professional with any questions about this product.