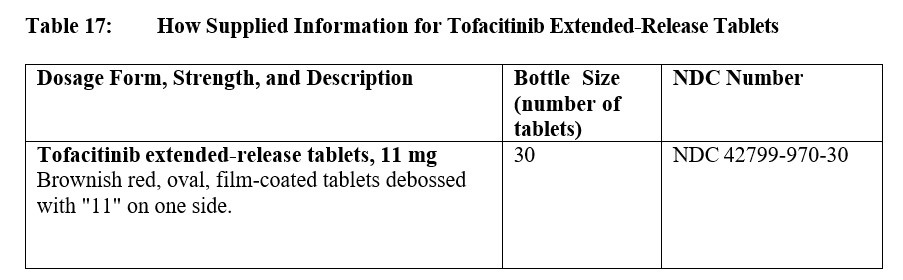
1 (11mg Bottle Label)
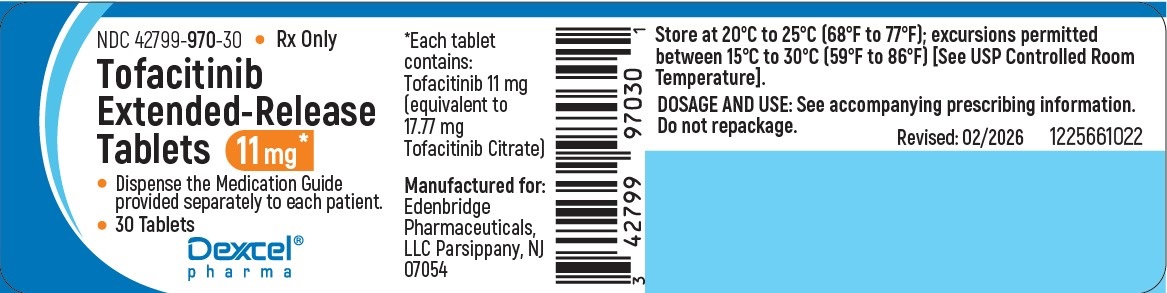
This text provides information about storing a medication between 20°C to 25°C (68°F to 77°F) with permitted excursions. The medication's temperature range for storage is specified as between 15°C to 30°C (59°F to 86°F). It mentions extended release tablets equivalent to 11 mg of tofacitinib. The text also instructs not to repackage the tablets and refers to accompanying prescribing information for dosage and use details. Additionally, it indicates that the Medication Guide should be dispensed separately to each patient and mentions the manufacturer as Dexcel® LLC located in Parsippany, NJ.*