Testosterone Gel, Metered
Product Images NDC 43598-304

View Photos of Packaging, Regulatory Labels, and Product Appearance

Product Visual Gallery

This gallery contains 7 technical images submitted to the FDA as part of the official labeling for Testosterone (NDC 43598-304). Unlike standard consumer photos, these assets often include clinical data figures, molecular chemical structures, and official manufacturer packaging layouts.

As provided by Dr. Reddy's Laboratories, Inc., these visuals offer a comprehensive scientific overview of the product's physical and chemical identity, aiding pharmacists and researchers in product verification and study.

FDA Label Image

Carton (Carton)

Carton (Carton)
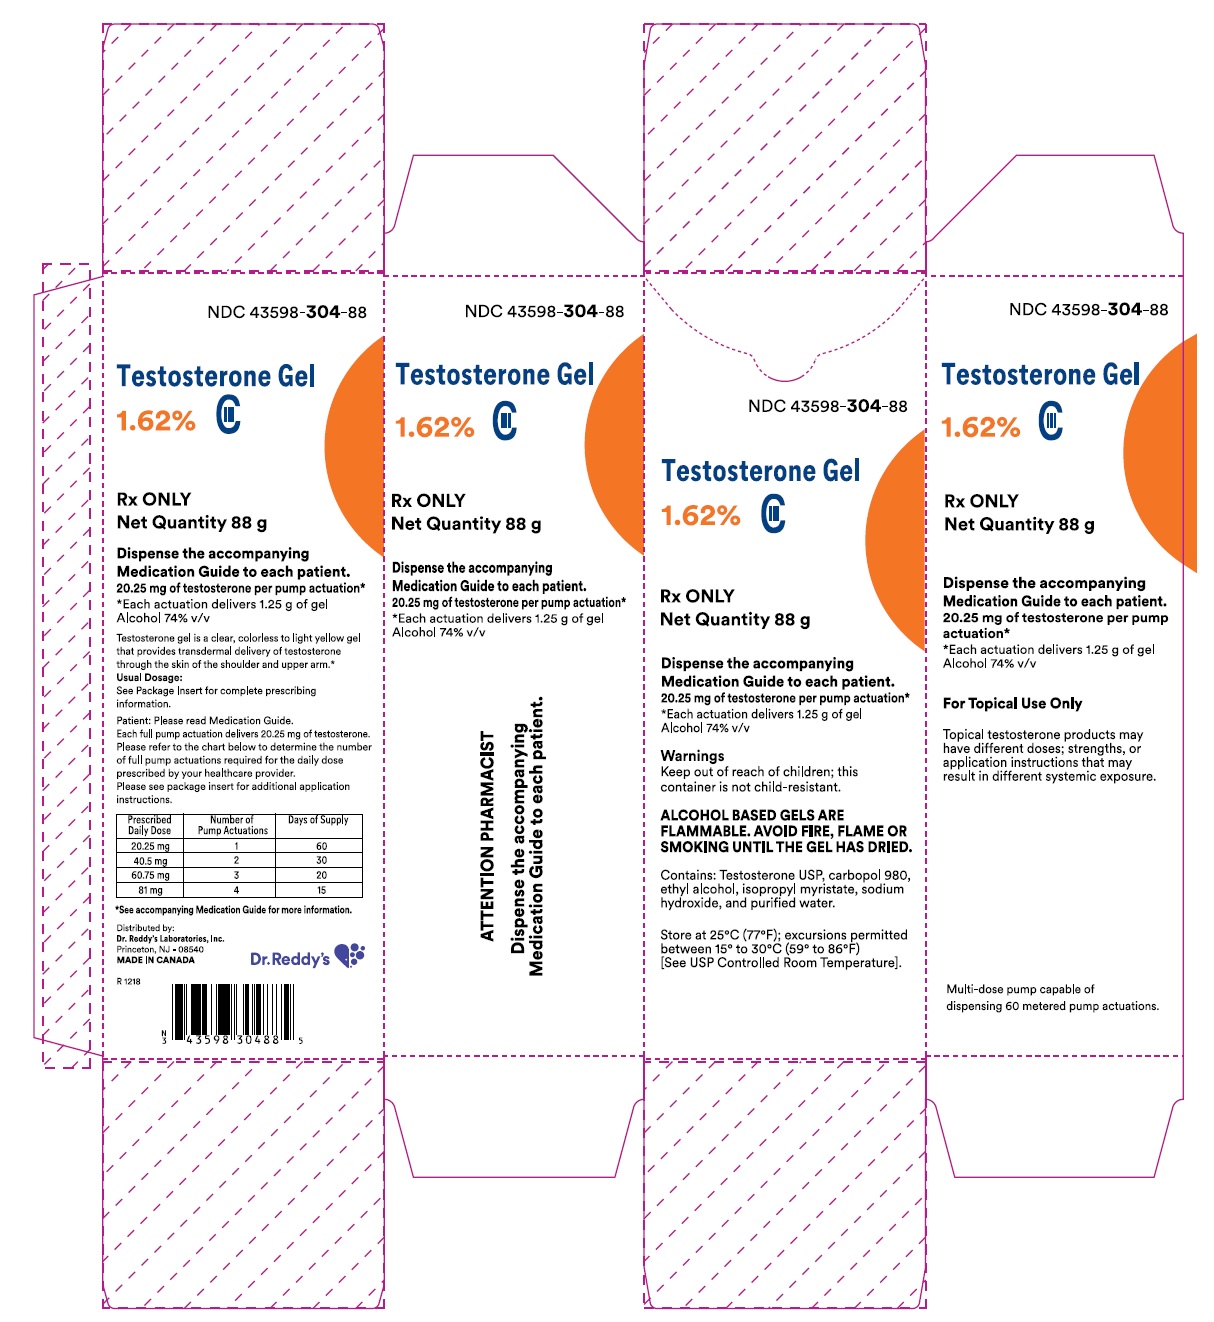
Packaging label for Testosterone Gel 1.62% metered gel by Dr. Reddy's Laboratories, Inc. The label shows a net quantity of 88 g and includes dosage instructions, warnings about flammability, a list of inactive ingredients, and a medication guide notice. It states the product is for topical use only and provides storage temperature recommendations.*
FDA Label Image

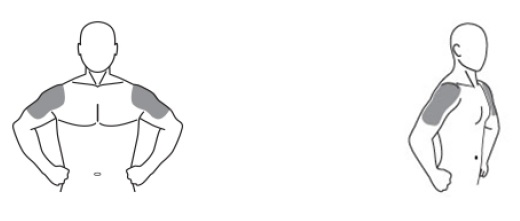
Figure-a (Figure A)

Figure-a (Figure A)
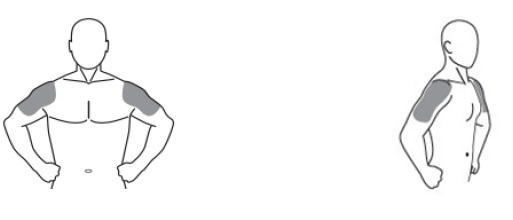
Illustration showing proper application sites on the upper arms and shoulders for a transdermal gel, indicated by shaded areas on a male figure viewed from front and side angles.*
FDA Label Image

Figure1 (Figure1)

Figure1 (Figure1)
Illustration showing application site areas for testosterone transdermal gel on the body. The shaded regions indicate the upper arms and shoulders as recommended sites for gel application.*
FDA Label Image

Figure2 (Figure2)

Figure2 (Figure2)
A line graph showing total testosterone (T) levels in ng/dL over a 24-hour period. The graph compares two application methods of testosterone gel: upper arms/shoulders versus rotation of abdomen and upper arms/shoulders. The x-axis represents time in hours, while the y-axis shows testosterone concentration. Data points include error bars indicating variability.*
FDA Label Image

Figure3 (Figure3)

Figure3 (Figure3)
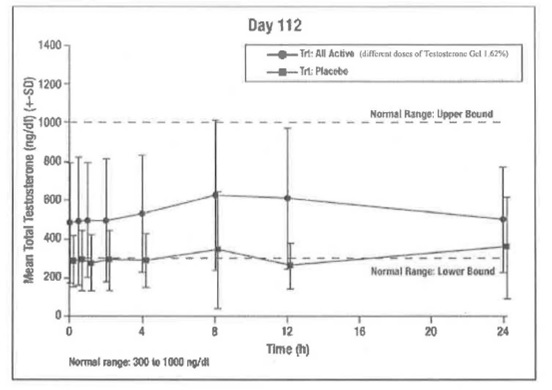
A line graph displaying mean total testosterone levels (ng/dL ± SD) over time (hours) up to 24 hours after dosing on day 112. It compares two treatments: Testosterone Gel 1.62% (all active doses) and placebo, showing testosterone levels relative to the normal range (300 to 1000 ng/dL) with upper and lower bound markers.*
FDA Label Image

Figure4 (Figure4)

Figure4 (Figure4)
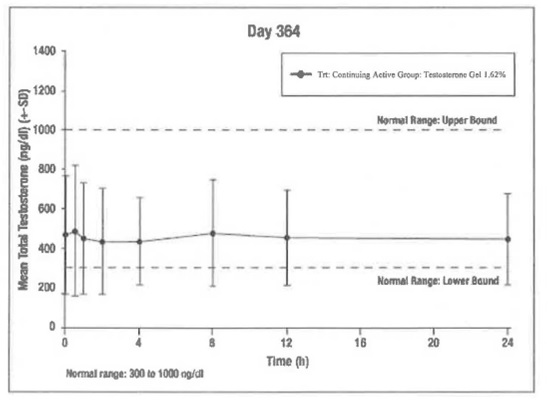
A line graph titled 'Day 364' displaying the mean total testosterone levels (ng/dl) over 24 hours for a group treated with Testosterone Gel 1.62%. The Y-axis represents mean testosterone levels with standard deviation, and the X-axis shows time in hours. The graph includes upper and lower bounds indicating the normal testosterone range (300 to 1000 ng/dl).*
FDA Label Image

Stracture (Stracture)

Stracture (Stracture)
Chemical structure of testosterone, showing its steroid ring system. The image includes the molecular formula C19H28O2 and molecular weight 288.42.*

* About these descriptions: Image descriptions on this page are generated by automated AI analysis of the product label images from the manufacturer's FDA label submission (SPL). They are provided for reference only and may contain errors or omissions. Always rely on the printed label itself and the official FDA labeling, and consult a pharmacist or healthcare professional with any questions about this product.