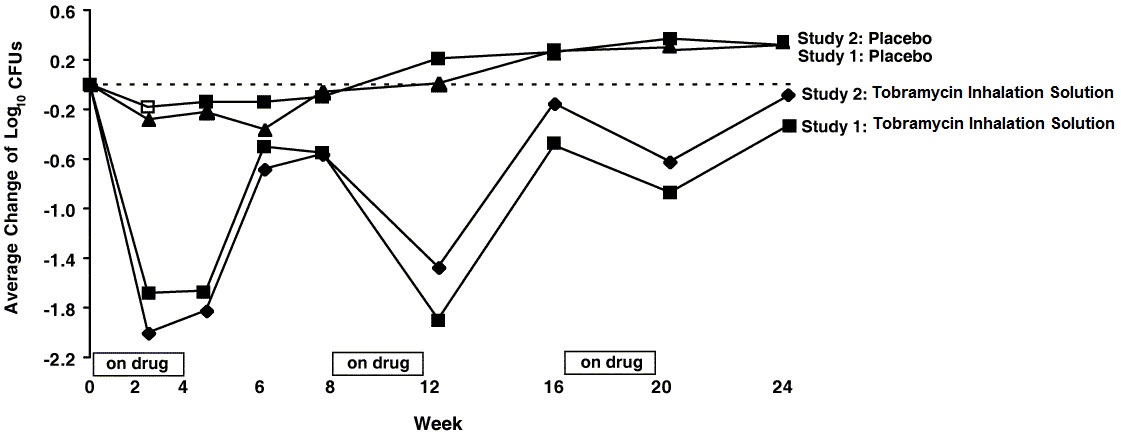
Figure1 (Figure1)
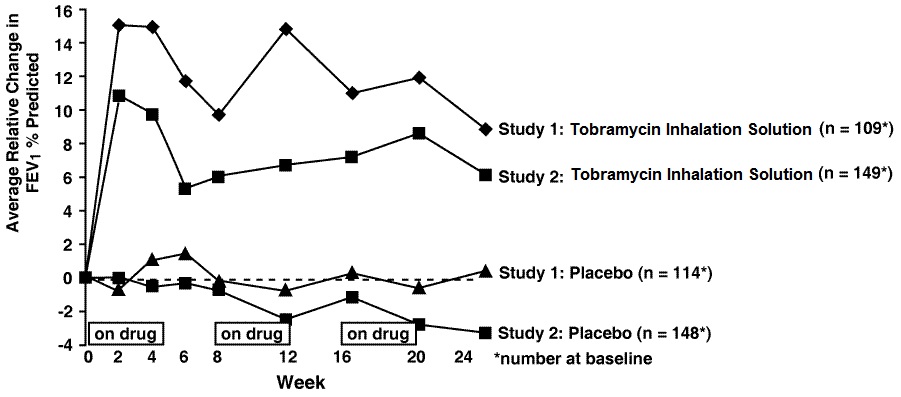
This is a chart/table showing the average relative change in FEV1 % (forced expiratory volume in one second) predicted for four different groups in two studies involving Tobramycin Inhalation Solution and Placebo. The groups are distinguished by the drug/placebo they received, and the number of participants in each group is also mentioned. The chart also shows the duration of the study in weeks.*