Spl-hydroxyprogesterone-caproate-figure-1 (Spl Hydroxyprogesterone Caproate Figure 1)
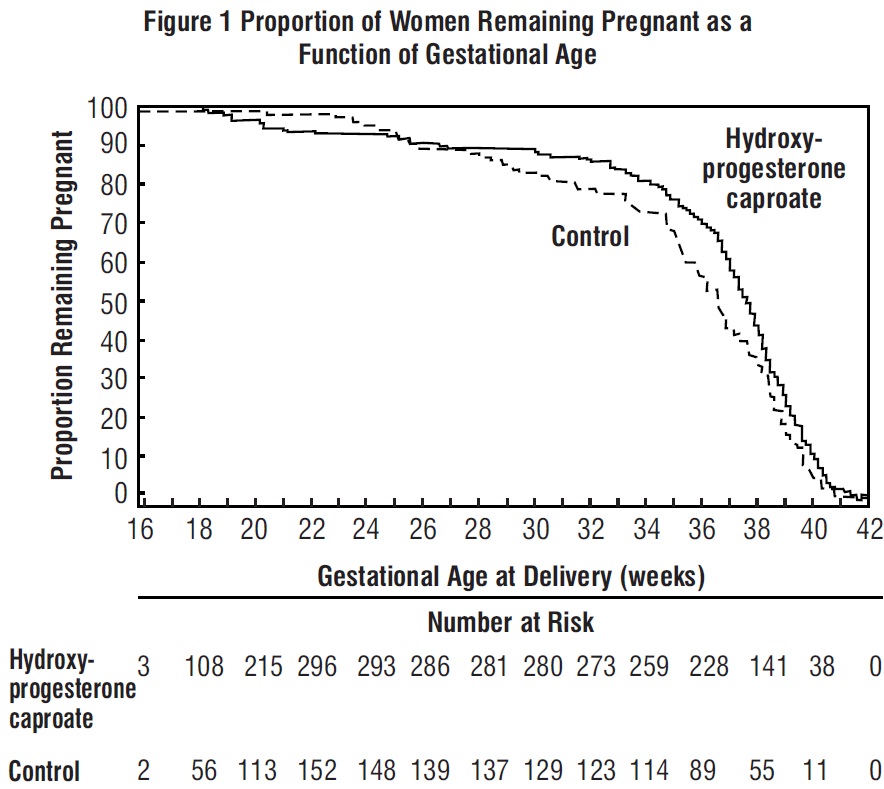
This appears to be a graph of the proportion of women who remain pregnant as a function of gestational age with hydroxyprogesterone caproate and control groups. The gestational age (in weeks) is plotted on the X-axis and the proportion of women remaining pregnant is shown on the Y-axis. There are two lines on the graph, one for the group given hydroxyprogesterone caproate and the other for the control group. The number at risk for each group is also shown.*
