Figure 1 (Lunsumio 01)
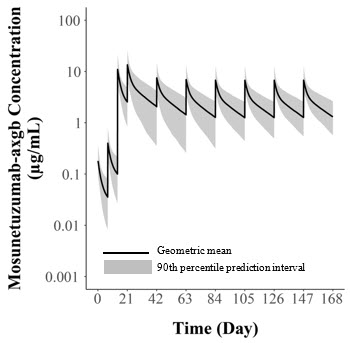
This appears to be a graph or chart showing the concentration of Mosunetuzumab-axgb over time, with time measured in days on the x-axis and concentration measured in ng/mL on the y-axis. There is also a percentile prediction interval shown, but without additional context it is unclear what this refers to.*