Posimir
Product Images NDC 51715-660

View Photos of Packaging, Regulatory Labels, and Product Appearance

Product Visual Gallery

This gallery contains 6 technical images submitted to the FDA as part of the official labeling for Posimir (NDC 51715-660). Unlike standard consumer photos, these assets often include clinical data figures, molecular chemical structures, and official manufacturer packaging layouts.

As provided by Innocoll Pharmaceuticals, these visuals offer a comprehensive scientific overview of the product's physical and chemical identity, aiding pharmacists and researchers in product verification and study.

FDA Label Image

Principal Display Panel (5 mL Vial Label)
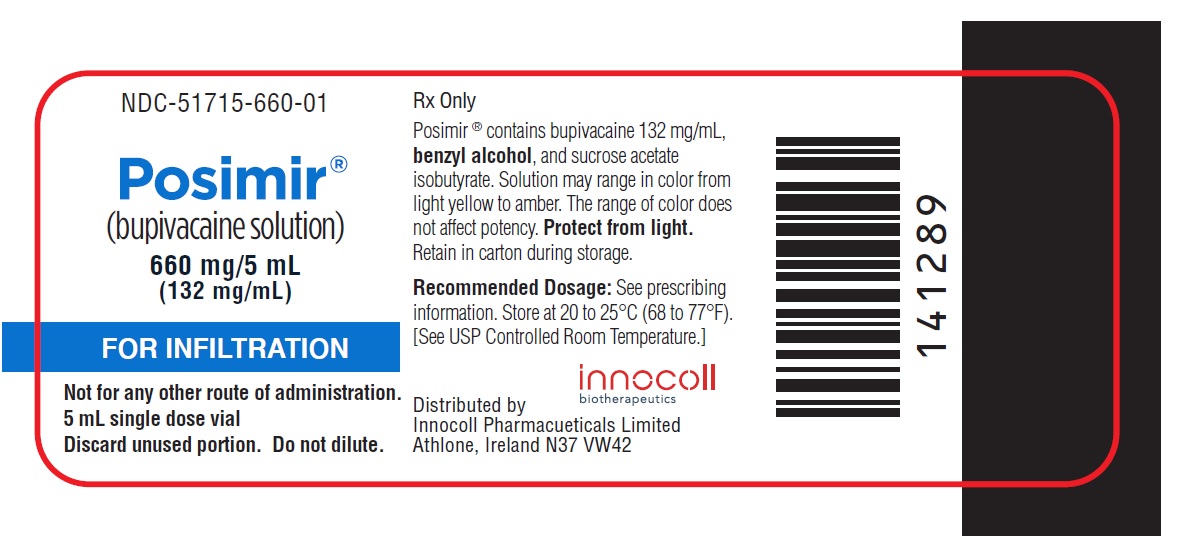
Principal Display Panel (5 mL Vial Label)
POSIMIR (bupivacaine solution) 660 mg/5 mL (132 mg/mL) vial label for infiltration. Highlighted is a 5 mL single dose vial labeled for single use, not to dilute and only for infiltration route. The label includes storage instructions, active ingredient concentration including benzyl alcohol, and distributor Innocoll Pharmaceuticals Limited, Athlone, Ireland.*
FDA Label Image

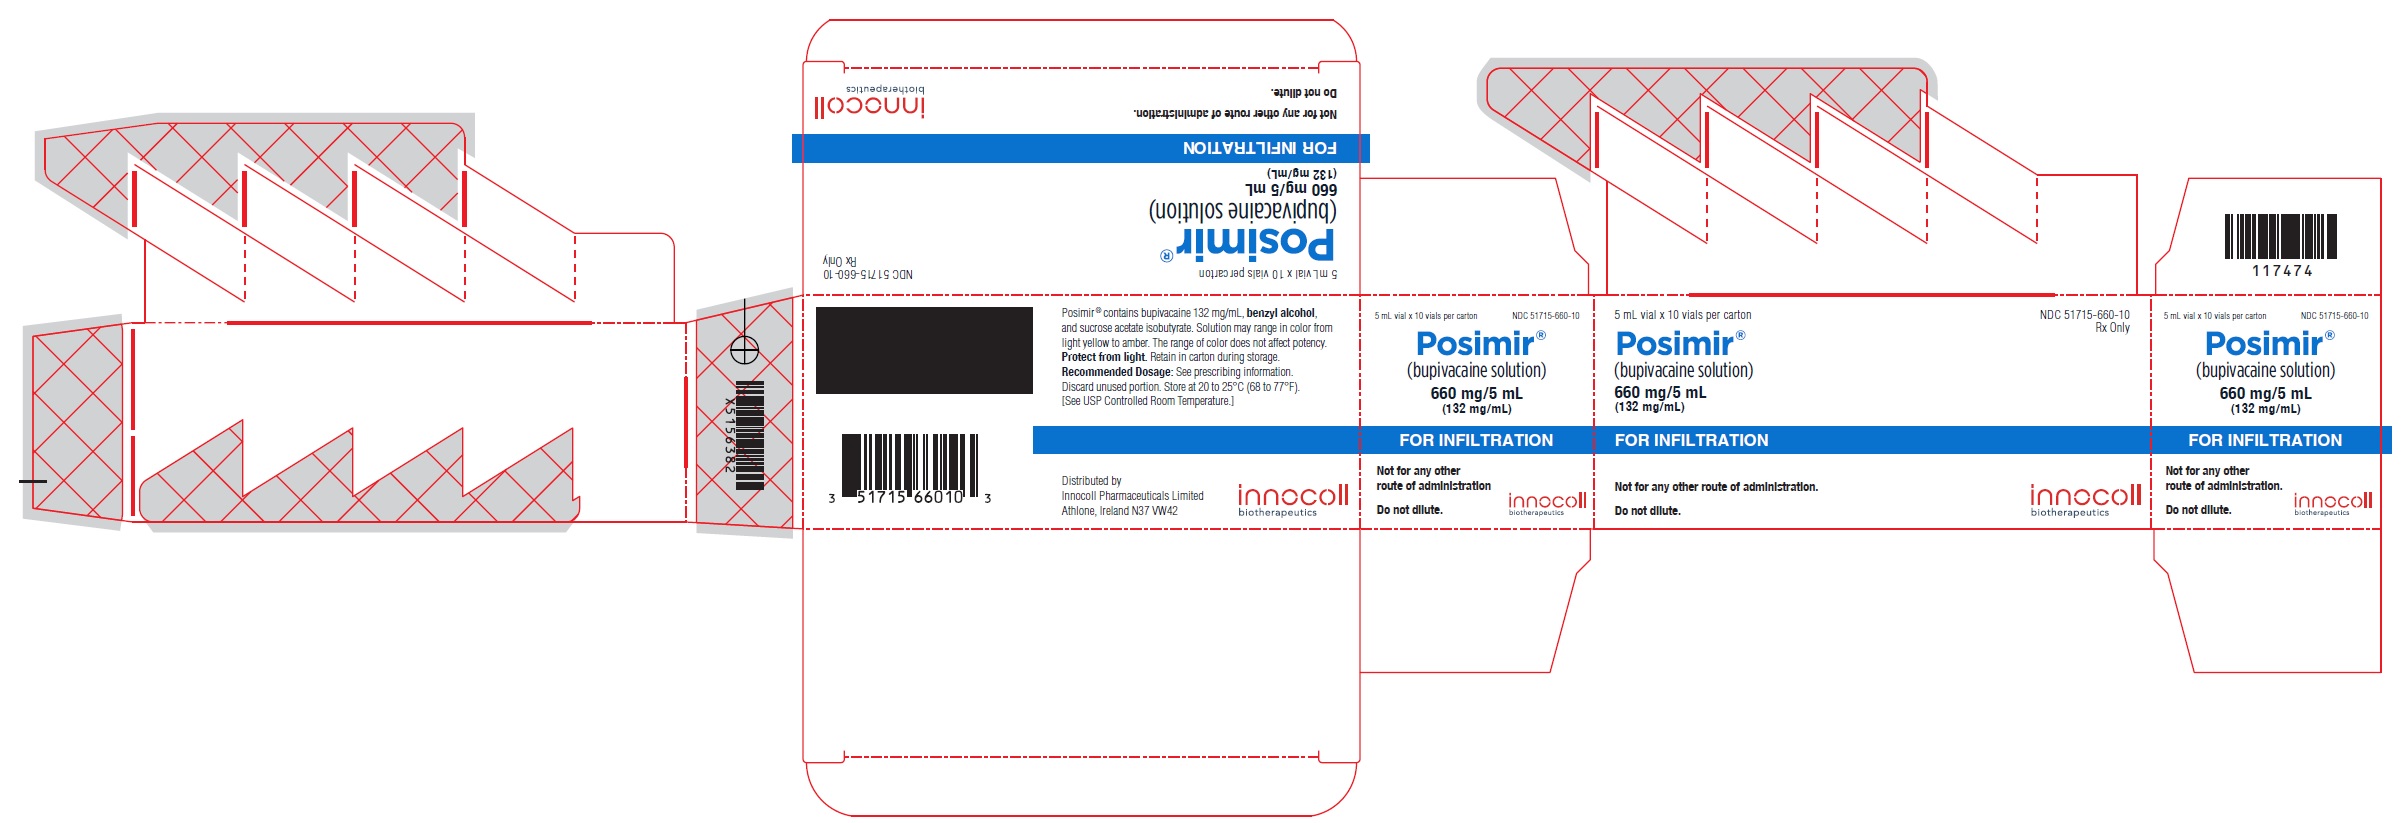
Principal Display Panel (5 mL Carton Label)

Principal Display Panel (5 mL Carton Label)
POSIMIR (bupivacaine solution) 660 mg/5 mL (132 mg/mL) carton label for infiltration. The packaging indicates 5 mL vials with 10 vials per carton. Distributed by Innocoll Pharmaceuticals Limited, the label includes usage instructions stating it is for infiltration only, not for any other route, and should not be diluted. The design features the POSIMIR logo in blue and the Innocoll biotherapeutics logo in red.*
FDA Label Image

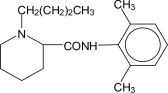
Structure Of Bupivacaine (Pos03 0001 01)

Structure Of Bupivacaine (Pos03 0001 01)
Chemical structure of the active ingredient in POSIMIR, showing a complex organic molecule with a piperidine ring, an amide group, and a dimethylphenyl group, consistent with its pharmaceutical composition.*
FDA Label Image

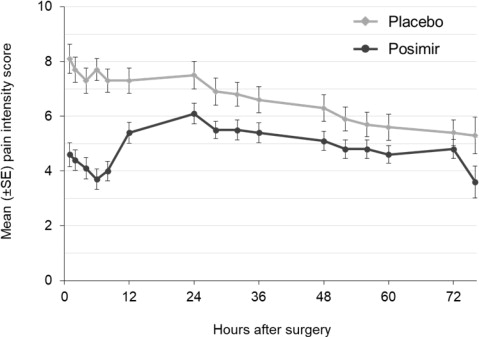
Figure 1 (Pos03 0001 02)

Figure 1 (Pos03 0001 02)
A line graph comparing mean (±SE) pain intensity scores over 72 hours after surgery for POSIMIR and placebo groups. The x-axis represents hours after surgery, and the y-axis shows the pain intensity score. Two lines indicate pain scores for POSIMIR (black circles) and placebo (gray diamonds), with error bars for standard error.*
FDA Label Image

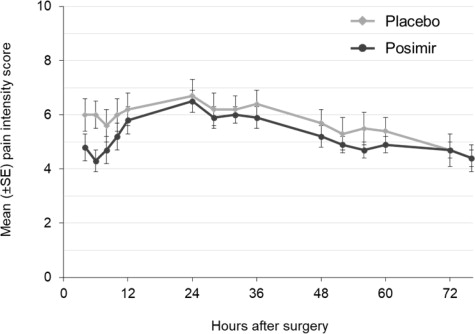
Figure 2 (Pos03 0001 03)

Figure 2 (Pos03 0001 03)
A line graph comparing mean pain intensity scores (± standard error) over time in hours after surgery for two groups: Placebo and Posimir. The x-axis represents hours after surgery (0 to 72) and the y-axis represents mean pain intensity score (0 to 10). Data points with error bars show the trend of pain scores for both groups across the time period.*
FDA Label Image

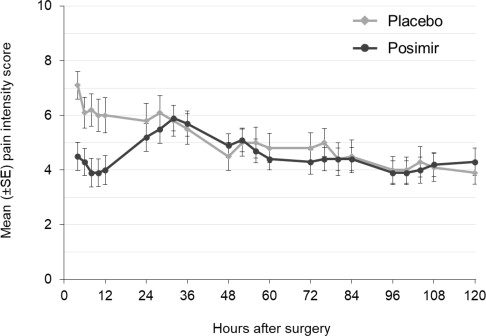
Figure 3 (Pos03 0001 04)

Figure 3 (Pos03 0001 04)
A line graph comparing mean pain intensity scores over 120 hours after surgery for Posimir and placebo groups. The x-axis represents hours after surgery, while the y-axis shows mean pain intensity scores with standard error bars. Posimir data is shown with a dark line and placebo with a gray line.*

* About these descriptions: Image descriptions on this page are generated by automated AI analysis of the product label images from the manufacturer's FDA label submission (SPL). They are provided for reference only and may contain errors or omissions. Always rely on the printed label itself and the official FDA labeling, and consult a pharmacist or healthcare professional with any questions about this product.