Levetiracetam
Product Images NDC 53808-0377

18 FDA label images from State Of Florida Doh Central Pharmacy · Packaging, Regulatory Labels, and Product Appearance

Product Visual Gallery

This gallery contains 18 technical images submitted to the FDA as part of the official labeling for Levetiracetam (NDC 53808-0377). Unlike standard consumer photos, these assets often include clinical data figures, molecular chemical structures, and official manufacturer packaging layouts.

As provided by State Of Florida Doh Central Pharmacy, these visuals offer a comprehensive scientific overview of the product's physical and chemical identity, aiding pharmacists and researchers in product verification and study.

FDA Label Image

Structural Formula For Levetiracetam (432eafc0 Cf2c 4bed 9ede F63f9f4793b1 01)

Structural Formula For Levetiracetam (432eafc0 Cf2c 4bed 9ede F63f9f4793b1 01)
Chemical structure of Levetiracetam, showing a five-membered ring with nitrogen and oxygen atoms, and attached functional groups including an amide (CONH2) and ethyl group.*
FDA Label Image

Figure 1 (432eafc0 Cf2c 4bed 9ede F63f9f4793b1 02)

Figure 1 (432eafc0 Cf2c 4bed 9ede F63f9f4793b1 02)
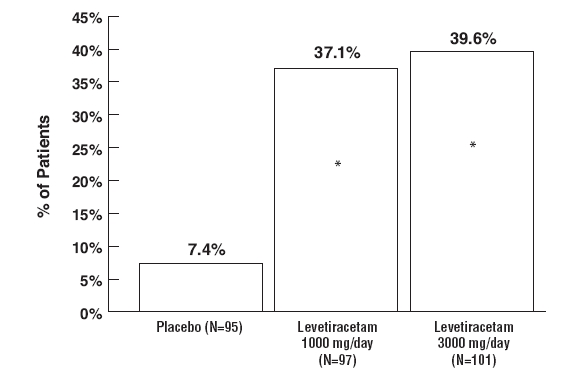
A vertical bar chart showing the percentage of patients across three groups: Placebo (7.4%), Levetiracetam 1000 mg/day (37.1%), and Levetiracetam 3000 mg/day (39.6%). The y-axis represents the percentage of patients from 0% to 45%, and the x-axis labels the treatment groups with their respective sample sizes (N).*
FDA Label Image

Table 2 (432eafc0 Cf2c 4bed 9ede F63f9f4793b1 03)

Table 2 (432eafc0 Cf2c 4bed 9ede F63f9f4793b1 03)
Data table showing statistical comparison of percent reduction in partial seizure frequency for Levetiracetam at 1000 mg/day and 2000 mg/day doses versus placebo. It includes participant numbers and notes statistical significance of reductions compared to placebo.*
FDA Label Image

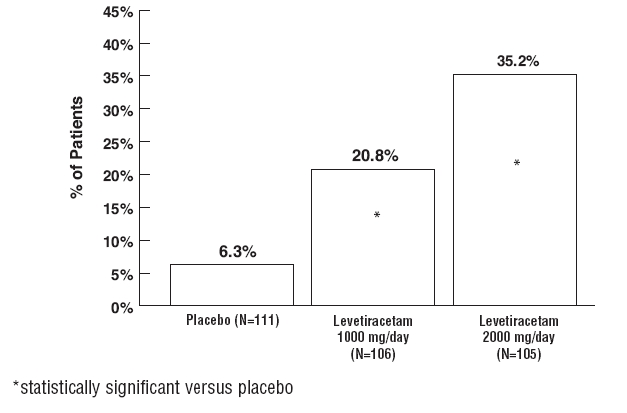
Figure 2 (432eafc0 Cf2c 4bed 9ede F63f9f4793b1 04)

Figure 2 (432eafc0 Cf2c 4bed 9ede F63f9f4793b1 04)
A bar chart showing the percentage of patients in three groups: Placebo (6.3%), Levetiracetam 1000 mg/day (20.8%), and Levetiracetam 2000 mg/day (35.2%). The y-axis represents the percentage of patients, ranging from 0% to 45%. Asterisks indicate statistically significant differences versus placebo for both Levetiracetam groups.*
FDA Label Image

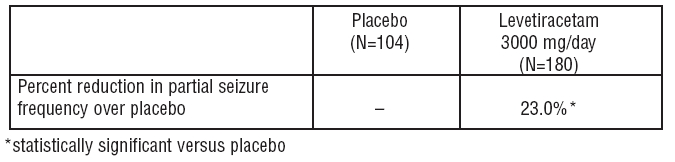
Table 3 (432eafc0 Cf2c 4bed 9ede F63f9f4793b1 05)

Table 3 (432eafc0 Cf2c 4bed 9ede F63f9f4793b1 05)
A data table comparing percent reduction in partial seizure frequency between placebo (N=104) and Levetiracetam 3000 mg/day (N=180). The table indicates a 23.0% reduction for Levetiracetam, noted as statistically significant versus placebo, which shows no reduction.*
FDA Label Image

Figure 3 (432eafc0 Cf2c 4bed 9ede F63f9f4793b1 06)

Figure 3 (432eafc0 Cf2c 4bed 9ede F63f9f4793b1 06)
A bar chart comparing the percentage of patients responding to placebo versus Levetiracetam 3000 mg/day. The x-axis shows two groups: Placebo (N=104) and Levetiracetam 3000 mg/day (N=180). The y-axis represents the percentage of patients, ranging from 0% to 45%. The placebo group has 14.4% of patients, while the Levetiracetam group shows 39.4%, with a note indicating statistical significance versus placebo.*
FDA Label Image

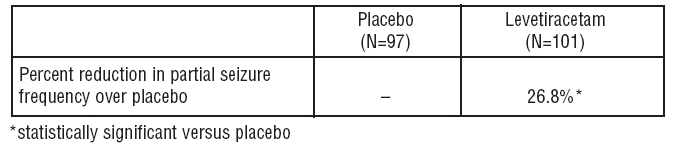
Table 4 (432eafc0 Cf2c 4bed 9ede F63f9f4793b1 07)

Table 4 (432eafc0 Cf2c 4bed 9ede F63f9f4793b1 07)
A data table comparing percent reduction in partial seizure frequency over placebo between placebo (N=97) and Levetiracetam (N=101) groups. The Levetiracetam group shows a 26.8% reduction, noted as statistically significant versus placebo.*
FDA Label Image

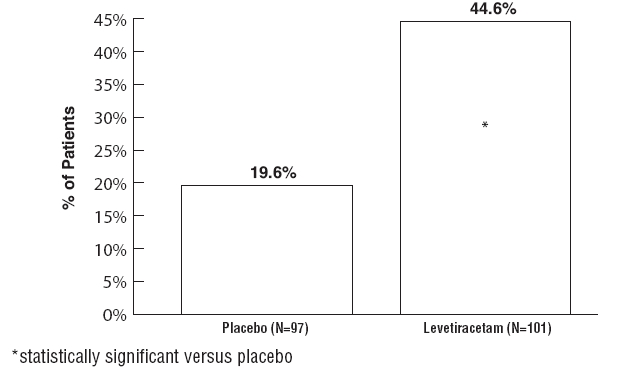
Figure 4 (432eafc0 Cf2c 4bed 9ede F63f9f4793b1 08)

Figure 4 (432eafc0 Cf2c 4bed 9ede F63f9f4793b1 08)
A bar chart comparing the percentage of patients between placebo and Levetiracetam groups. The placebo group shows 19.6% of patients, and the Levetiracetam group shows 44.6% of patients. The Levetiracetam group percentage is marked as statistically significant compared to placebo. The x-axis labels are Placebo (N=97) and Levetiracetam (N=101), and the y-axis represents the percentage of patients from 0% to 45%.*
FDA Label Image

Table 5 (432eafc0 Cf2c 4bed 9ede F63f9f4793b1 09)

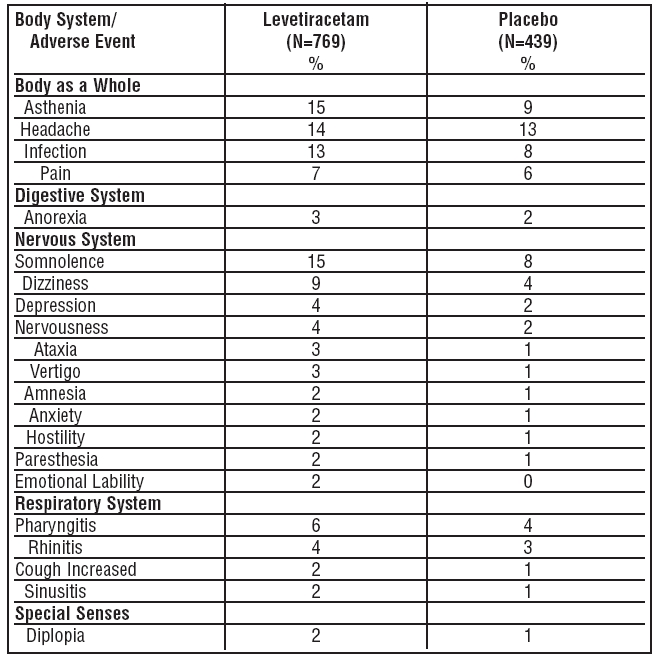
Table 5 (432eafc0 Cf2c 4bed 9ede F63f9f4793b1 09)
Adverse event frequency table comparing Levetiracetam (N=769) and placebo (N=439) groups. The table categorizes events by body system, listing percentages for symptoms such as asthenia, headache, infection, somnolence, dizziness, and others, illustrating the proportion of patients experiencing each event during the study.*
FDA Label Image

Table 6 (432eafc0 Cf2c 4bed 9ede F63f9f4793b1 10)

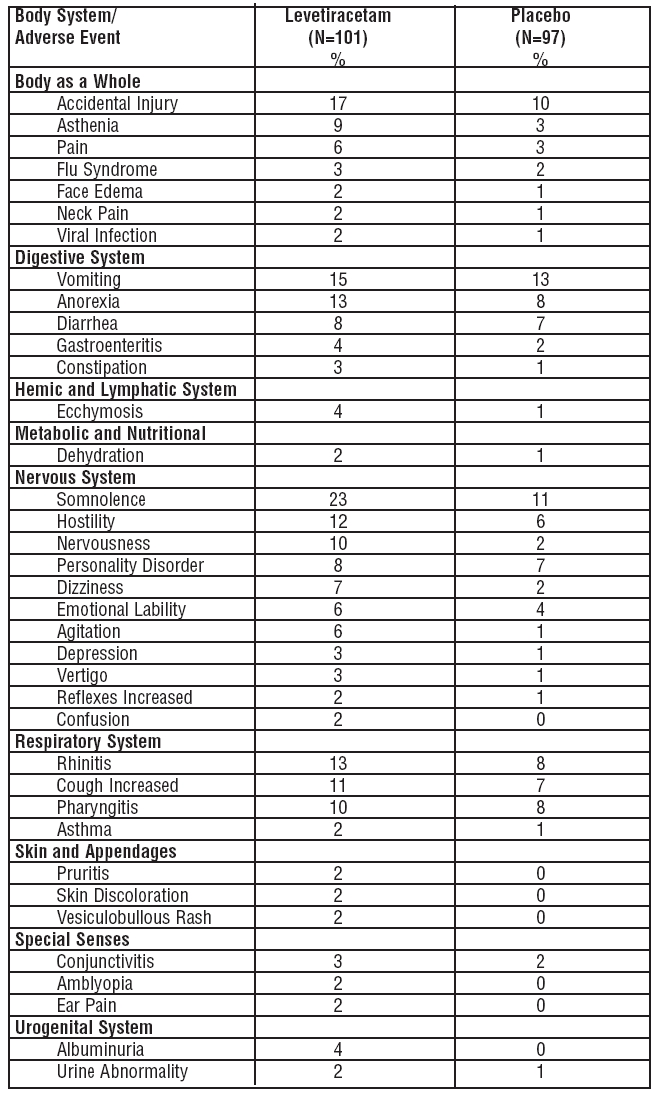
Table 6 (432eafc0 Cf2c 4bed 9ede F63f9f4793b1 10)
A data table comparing the percentage of subjects experiencing adverse events by body system for Levetiracetam (N=101) versus placebo (N=97). The table categorizes adverse events under body systems including Body as a Whole, Digestive, Hemic and Lymphatic, Metabolic and Nutritional, Nervous, Respiratory, Skin and Appendages, Special Senses, and Urogenital. Percentages for various specific adverse events are listed side-by-side for Levetiracetam and placebo groups.*
FDA Label Image

Table 7 (432eafc0 Cf2c 4bed 9ede F63f9f4793b1 11)

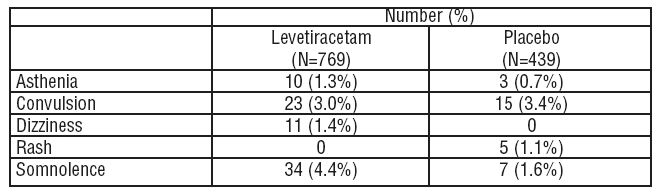
Table 7 (432eafc0 Cf2c 4bed 9ede F63f9f4793b1 11)
A data table comparing the incidence of adverse events, including asthenia, convulsion, dizziness, rash, and somnolence, reported as number and percentage among patients treated with Levetiracetam (N=769) versus placebo (N=439).*
FDA Label Image

Table 8 (432eafc0 Cf2c 4bed 9ede F63f9f4793b1 12)

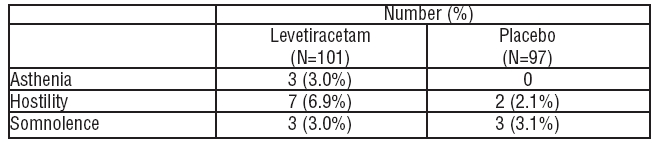
Table 8 (432eafc0 Cf2c 4bed 9ede F63f9f4793b1 12)
A data table comparing the number and percentage of participants experiencing asthenia, hostility, and somnolence in two groups: Levetiracetam (N=101) and Placebo (N=97). The table shows counts and percentages for each adverse effect in both groups.*
FDA Label Image

Table 9 (432eafc0 Cf2c 4bed 9ede F63f9f4793b1 13)

Table 9 (432eafc0 Cf2c 4bed 9ede F63f9f4793b1 13)
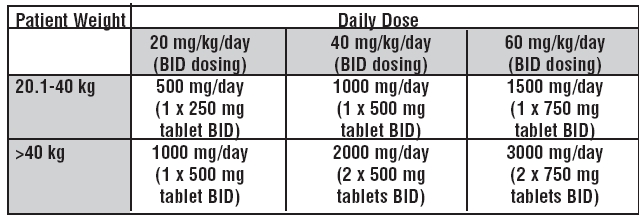
A dosing table for Levetiracetam showing daily dose recommendations based on patient weight and dosing levels of 20 mg/kg/day, 40 mg/kg/day, and 60 mg/kg/day, with specific tablet counts and strengths indicated for each category.*
FDA Label Image

Pediatric Dose Calculation (432eafc0 Cf2c 4bed 9ede F63f9f4793b1 14)

Pediatric Dose Calculation (432eafc0 Cf2c 4bed 9ede F63f9f4793b1 14)
A dosage calculation formula for Levetiracetam showing Total daily dose (mL/day) equals the product of Daily dose (mg/kg/day) and patient weight (kg), divided by 100 mg/mL.*
FDA Label Image

Clcr Calculation (432eafc0 Cf2c 4bed 9ede F63f9f4793b1 15)

Clcr Calculation (432eafc0 Cf2c 4bed 9ede F63f9f4793b1 15)
An illustration showing the formula to calculate creatinine clearance (CLcr) by estimating from age, weight, and serum creatinine, with an adjustment factor for female patients.*
FDA Label Image

Table 10 (432eafc0 Cf2c 4bed 9ede F63f9f4793b1 16)

Table 10 (432eafc0 Cf2c 4bed 9ede F63f9f4793b1 16)
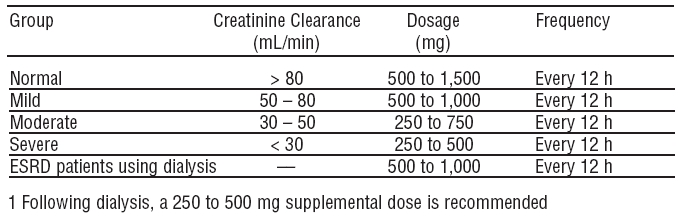
A dosage adjustment table for Levetiracetam indicating recommended dosages and frequency based on different creatinine clearance levels, including normal, mild, moderate, severe impairment, and ESRD patients using dialysis. It includes a supplemental dosing note for post-dialysis patients.*
FDA Label Image

Glenmark Logo (432eafc0 Cf2c 4bed 9ede F63f9f4793b1 17)

FDA Label Image

Levetiracetam 500mg Label (Levetiracetam 500mg (glenmark))

Levetiracetam 500mg Label (Levetiracetam 500mg (glenmark))
Label for Levetiracetam 500 mg tablets, quantity 30, Rx only. Manufactured or packaged by DOH Central Pharmacy, Tallahassee, FL 32304. Includes lot number and expiration date information, along with a barcode and UPC code.*

* About these descriptions: Image descriptions on this page are generated by automated AI analysis of the product label images from the manufacturer's FDA label submission (SPL). They are provided for reference only and may contain errors or omissions. Always rely on the printed label itself and the official FDA labeling, and consult a pharmacist or healthcare professional with any questions about this product.