Doxazosin Mesylate
Product Images NDC 53808-1017

4 FDA label images from State Of Florida Doh Central Pharmacy · Packaging, Regulatory Labels, and Product Appearance

Product Visual Gallery

This gallery contains 4 technical images submitted to the FDA as part of the official labeling for Doxazosin Mesylate (NDC 53808-1017). Unlike standard consumer photos, these assets often include clinical data figures, molecular chemical structures, and official manufacturer packaging layouts.

As provided by State Of Florida Doh Central Pharmacy, these visuals offer a comprehensive scientific overview of the product's physical and chemical identity, aiding pharmacists and researchers in product verification and study.

FDA Label Image

Label Image For 2mg (Doxazosin 2mg)
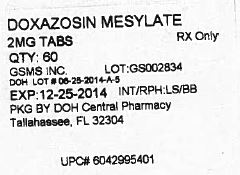
Label Image For 2mg (Doxazosin 2mg)
Doxazosin mesylate 2 mg tablet bottle label showing quantity of 60 tablets. The label includes manufacturer information as GSMS Inc., lot number GS002834, expiration date 12-25-2014, and packaging by DOH Central Pharmacy, Tallahassee, FL. The label also displays the UPC code 6042995401 and indicates the drug is RX only.*
FDA Label Image

Chemical Structure (Doxazosin Mesylate)

Chemical Structure (Doxazosin Mesylate)
Chemical structure of doxazosin mesylate, showing its molecular arrangement including methoxy groups, piperazine ring, and the mesylate moiety associated with the compound.*
FDA Label Image

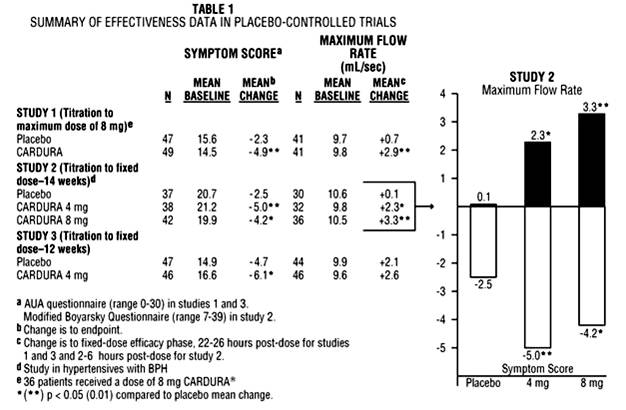
Table 1 (Feea8d72 5781 46d5 831d 855f478c704d 02)

Table 1 (Feea8d72 5781 46d5 831d 855f478c704d 02)
A data table titled 'Summary of Effectiveness Data in Placebo-Controlled Trials' presenting symptom scores and maximum flow rates for placebo and Doxazosin mesylate (Cardura) at various doses and study durations. It includes sample sizes, baseline means, mean changes, and notes on study design and statistical significance, alongside a bar graph illustrating maximum flow rate changes in Study 2.*
FDA Label Image

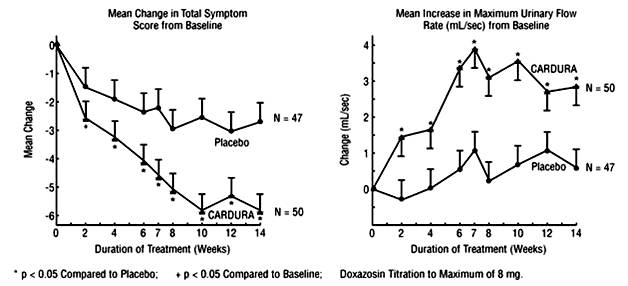
Figure 1 (Study 1)

Figure 1 (Study 1)
Two line graphs depicting clinical data related to Doxazosin mesylate (Cardura) compared to placebo over a 14-week treatment period. The left graph shows mean change in total symptom score from baseline, with Cardura demonstrating a greater decrease than placebo. The right graph illustrates mean increase in maximum urinary flow rate from baseline, with Cardura showing a larger increase compared to placebo.*

* About these descriptions: Image descriptions on this page are generated by automated AI analysis of the product label images from the manufacturer's FDA label submission (SPL). They are provided for reference only and may contain errors or omissions. Always rely on the printed label itself and the official FDA labeling, and consult a pharmacist or healthcare professional with any questions about this product.