Divalproex Sodium
Product Images NDC 54868-6072

6 FDA label images from Physicians Total Care, Inc. · Packaging, Regulatory Labels, and Product Appearance

Product Visual Gallery

This gallery contains 6 technical images submitted to the FDA as part of the official labeling for Divalproex Sodium (NDC 54868-6072). Unlike standard consumer photos, these assets often include clinical data figures, molecular chemical structures, and official manufacturer packaging layouts.

As provided by Physicians Total Care, Inc., these visuals offer a comprehensive scientific overview of the product's physical and chemical identity, aiding pharmacists and researchers in product verification and study.

FDA Label Image

Image Of Structural Formula (B4093fb8 152f 476a 8316 0071647e48ec 01)
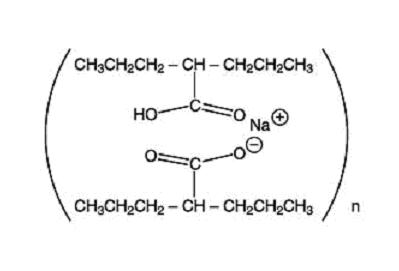
Image Of Structural Formula (B4093fb8 152f 476a 8316 0071647e48ec 01)
Chemical structure of divalproex sodium, showing the molecular arrangement including carbon chains, carboxylate groups with sodium ions, and the repeating unit indicated by 'n'.*
FDA Label Image

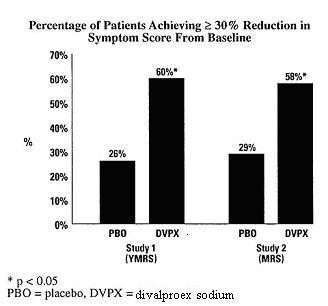
Figure 1 (B4093fb8 152f 476a 8316 0071647e48ec 02)

Figure 1 (B4093fb8 152f 476a 8316 0071647e48ec 02)
A bar graph depicting the percentage of patients achieving 30% or more reduction in symptom score from baseline in two studies. It compares placebo (PBO) and divalproex sodium (DVPX) groups for Study 1 (YMRS) and Study 2 (MRS). The graph shows higher percentage reduction for DVPX groups (60% and 58%) compared to placebo groups (26% and 29%) with statistical significance noted for DVPX.*
FDA Label Image

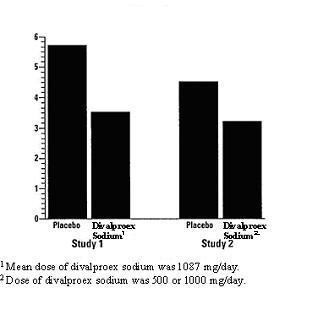
Figure 2 (B4093fb8 152f 476a 8316 0071647e48ec 03)

Figure 2 (B4093fb8 152f 476a 8316 0071647e48ec 03)
A bar graph comparing two studies that show measurements for placebo and divalproex sodium groups. The y-axis measures a variable from 0 to 6, with Study 1 and Study 2 represented side by side. Footnotes under the graph describe mean and dose ranges for divalproex sodium used in the studies.*
FDA Label Image

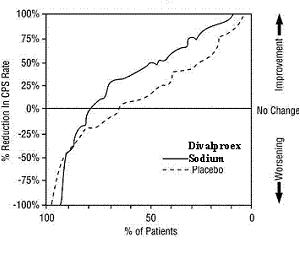
Figure 3 (B4093fb8 152f 476a 8316 0071647e48ec 04)

Figure 3 (B4093fb8 152f 476a 8316 0071647e48ec 04)
A cumulative distribution plot showing the percent reduction in CPS rate for Divalproex Sodium compared to placebo. The y-axis represents percent reduction ranging from -100% to 100%, indicating worsening to improvement, while the x-axis shows the percentage of patients from 0 to 100%. Divalproex Sodium is represented by a solid line, placebo by a dashed line.*
FDA Label Image

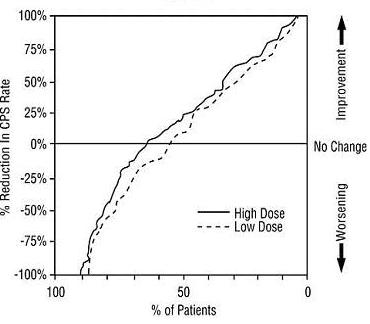
Figure 4 (B4093fb8 152f 476a 8316 0071647e48ec 05)

Figure 4 (B4093fb8 152f 476a 8316 0071647e48ec 05)
A line graph showing the percentage reduction in CPS (Clinical seizure parameter) rate versus percent of patients. The graph compares High Dose (solid line) and Low Dose (dashed line) treatments. The vertical axis ranges from -100% (worsening) to 100% (improvement), with a midpoint at no change. The horizontal axis shows percent of patients from 100 to 0.*
FDA Label Image

Image Of 500 mg Package Label (Package Label)

Image Of 500 mg Package Label (Package Label)
Divalproex Sodium 500 mg delayed-release tablets bottle label from Physicians Total Care, Inc. The label indicates a quantity of 30 tablets per bottle with warnings and storage instructions. The label includes the product NDC 54868-6072 and a caution that federal law prohibits dispensing without a prescription.*

* About these descriptions: Image descriptions on this page are generated by automated AI analysis of the product label images from the manufacturer's FDA label submission (SPL). They are provided for reference only and may contain errors or omissions. Always rely on the printed label itself and the official FDA labeling, and consult a pharmacist or healthcare professional with any questions about this product.