Palonosetron Injection, Solution
Product Images NDC 55111-694

6 FDA label images from Dr.reddy's Laboratories Limited · Packaging, Regulatory Labels, and Product Appearance

Product Visual Gallery

This gallery contains 6 technical images submitted to the FDA as part of the official labeling for Palonosetron (NDC 55111-694). Unlike standard consumer photos, these assets often include clinical data figures, molecular chemical structures, and official manufacturer packaging layouts.

As provided by Dr.reddy's Laboratories Limited, these visuals offer a comprehensive scientific overview of the product's physical and chemical identity, aiding pharmacists and researchers in product verification and study.

FDA Label Image

025carton (025carton)

025carton (025carton)
Packaging label for Palonosetron Hydrochloride Injection 0.25 mg/5 mL (0.05 mg/mL) by Dr. Reddy's Laboratories Limited. The label shows it is for intravenous injection only, with one 5 mL single-dose sterile vial. Additional details include inactive ingredients, storage instructions, and a barcode.*
FDA Label Image

025vial (025vial)

025vial (025vial)
Palonosetron hydrochloride injection label showing 0.25 mg/5 mL (0.05 mg/mL) strength in intravenous solution form. The label includes storage instructions (20°C to 25°C), single-dose vial indication, preservative-free note, and Dr. Reddy's Laboratories Limited as the manufacturer. NDC 55111-694-07 is visible along with lot and expiration date fields.*
FDA Label Image

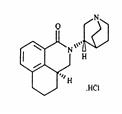
Structure (Structure)

Structure (Structure)
Chemical structure of Palonosetron hydrochloride, depicting the molecular arrangement of the active ingredient in the Palonosetron injection solution by Dr.Reddy's Laboratories Limited.*
FDA Label Image

Table5 (Table5)

Table5 (Table5)
A horizontal bar chart depicting the difference in complete response rates expressed as percentages, with the x-axis labeled from -10 to 35. Three bars represent different percentage values: 2% (23%), 1-2% (22%), and 9% (13%), each associated with markers and confidence intervals.*
FDA Label Image

Table6

Table6
A chart showing the difference in complete response rates, with values ranging from -10 to 35 on the horizontal axis. The chart includes confidence interval bars at approximately 3% and 8%, indicating measured differences in response rates.*
FDA Label Image

Table7

Table7
A chart showing difference in complete response rates with two data points: one at approximately 0% with a confidence interval from about -5% to 5%, and another at approximately 7% with a confidence interval from about -3% to 31%. The x-axis is labeled 'Difference in Complete Response Rates' ranging from -10 to 35.*

* About these descriptions: Image descriptions on this page are generated by automated AI analysis of the product label images from the manufacturer's FDA label submission (SPL). They are provided for reference only and may contain errors or omissions. Always rely on the printed label itself and the official FDA labeling, and consult a pharmacist or healthcare professional with any questions about this product.