Alfuzosin Hydrochloride
Product Images NDC 55648-738

10 FDA label images from Wockhardt Limited · Packaging, Regulatory Labels, and Product Appearance

Product Visual Gallery

This gallery contains 10 technical images submitted to the FDA as part of the official labeling for Alfuzosin Hydrochloride (NDC 55648-738). Unlike standard consumer photos, these assets often include clinical data figures, molecular chemical structures, and official manufacturer packaging layouts.

As provided by Wockhardt Limited, these visuals offer a comprehensive scientific overview of the product's physical and chemical identity, aiding pharmacists and researchers in product verification and study.

FDA Label Image

Label (Alfuzosintablets M Figure 01)

Label (Alfuzosintablets M Figure 01)
Label for Alfuzosin HCl Extended-Release Tablets, 10 mg, with 30 tablets per package. It includes dosage warnings, storage instructions, and pharmacist dispensing guidance. The label shows the Wockhardt Limited logo and lists manufacturing and distribution details, including locations in India and the USA. A barcode and NDC 64679-738-01 are present.*
FDA Label Image

Label (Alfuzosintablets M Figure 02)

Label (Alfuzosintablets M Figure 02)
Label for Alfuzosin HCl Extended-Release Tablets containing 10 mg of Alfuzosin hydrochloride. The label indicates a package size of 500 tablets, distributed by Wockhardt USA LLC and manufactured by Wockhardt Limited, Mumbai, India. It includes storage instructions and dispensing guidelines.*
FDA Label Image

Structure (Alfuzosintablets M Figure 03)

Structure (Alfuzosintablets M Figure 03)
Chemical structure of Alfuzosin Hydrochloride, showing its molecular arrangement including methoxy groups, an amine group, and a hydrochloride moiety.*
FDA Label Image

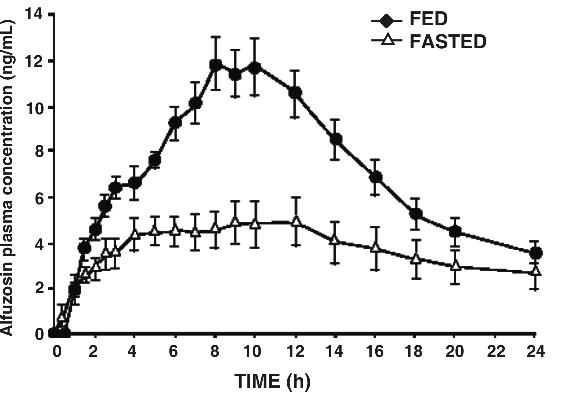
Figure 1 (Alfuzosintablets M Figure 04)

Figure 1 (Alfuzosintablets M Figure 04)
A line graph showing Alfuzosin plasma concentration (ng/mL) over 24 hours under fed and fasted conditions. The Y-axis represents Alfuzosin plasma concentration, and the X-axis shows time in hours. Two distinct curves illustrate concentration levels: higher with food intake (fed) and lower when fasting, both with standard error bars.*
FDA Label Image

Figure 2 (Alfuzosintablets M Figure 05)

Figure 2 (Alfuzosintablets M Figure 05)
A line graph comparing the mean change over days of treatment between placebo and Alfuzosin Hydrochloride extended-release tablets. The x-axis represents days of treatment (0, 28, 56, 84), and the y-axis shows mean change. The graph indicates a statistically significant difference (p < 0.001) favoring Alfuzosin Hydrochloride extended-release tablets.*
FDA Label Image

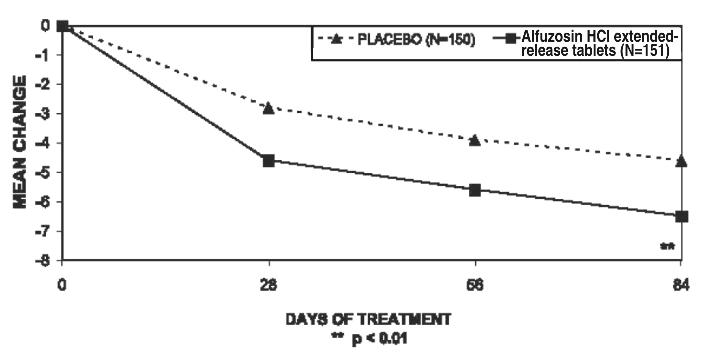
Figure 3 (Alfuzosintablets M Figure 06)

Figure 3 (Alfuzosintablets M Figure 06)
A line graph comparing the mean change in an unspecified measure over days of treatment between a placebo group and a group taking Alfuzosin HCl extended-release tablets. The horizontal axis represents days of treatment (0, 28, 56, 84), and the vertical axis shows mean change with values from 0 to -8. Data points indicate greater mean change in the Alfuzosin group compared to placebo, with statistically significant differences noted (p < 0.01).*
FDA Label Image

Figure 4 (Alfuzosintablets M Figure 07)

Figure 4 (Alfuzosintablets M Figure 07)
A line graph comparing mean change over days of treatment between placebo and Alfuzosin Hydrochloride extended-release tablets. The x-axis represents days of treatment (0, 28, 56, 84), and the y-axis shows mean change. The graph shows a greater decrease in mean change with Alfuzosin HCl compared to placebo over time, with statistical significance indicated at day 84 (p < 0.01).*
FDA Label Image

Figure 5 (Alfuzosintablets M Figure 08)

Figure 5 (Alfuzosintablets M Figure 08)
A line graph showing the mean change in mL/s over 84 days of treatment comparing Alfuzosin HCl extended-release tablets with placebo. The X-axis represents days of treatment (0, 28, 56, 84), and the Y-axis represents mean change in mL/s, ranging from 0 to 3. Data points show a significant increase for Alfuzosin HCl extended-release tablets, while placebo remains nearly constant. Statistical significance is indicated at p < 0.001.*
FDA Label Image

Figure 6 (Alfuzosintablets M Figure 09)

Figure 6 (Alfuzosintablets M Figure 09)
A line graph comparing mean change in mL/s over days of treatment between placebo and Alfuzosin HCl extended-release tablets groups. The x-axis represents days of treatment (0, 14, 28, 56, 84), and the y-axis shows mean change in mL/s ranging from 0 to 3. Data points for placebo (N=147) and Alfuzosin HCl extended-release tablets (N=136) are plotted, showing greater improvement with Alfuzosin over time, with statistical significance indicated at some points.*
FDA Label Image

Figure 7 (Alfuzosintablets M Figure 10)

Figure 7 (Alfuzosintablets M Figure 10)
A line graph comparing mean change in mL/s over days of treatment between Alfuzosin HCl extended-release tablets and placebo groups. The x-axis represents days of treatment (0, 14, 28, 56, 84) and the y-axis shows mean change in mL/s from 0 to 3. Two lines represent the groups: Alfuzosin HCl extended-release tablets with generally higher mean values, and placebo with lower mean values; statistical significance not indicated (NS p > 0.05).*

* About these descriptions: Image descriptions on this page are generated by automated AI analysis of the product label images from the manufacturer's FDA label submission (SPL). They are provided for reference only and may contain errors or omissions. Always rely on the printed label itself and the official FDA labeling, and consult a pharmacist or healthcare professional with any questions about this product.