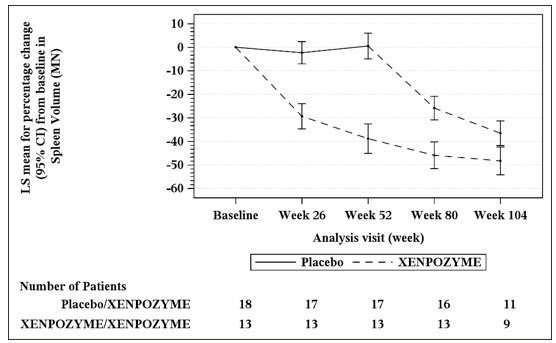
Figure 1 (Xenpozyme 01)
This appears to be a table showing the number of patients who were given either a placebo or a medication called XENPOZYME (which appears to be spelled out in capital letters) over a period of 104 weeks. The table contains columns for each of the five time points (Baseline, Week26, Week52, Week80, and Week104) and rows for each group of patients (those given placebo, and those given XENPOZYME). The number of patients in each group is shown for each time point. The meaning or context for the numbers is not clear.*