Inrebic Capsule
Product Images NDC 59572-720

5 FDA label images from Celgene Corporation · Packaging, Regulatory Labels, and Product Appearance

Product Visual Gallery

This gallery contains 5 technical images submitted to the FDA as part of the official labeling for Inrebic (NDC 59572-720). Unlike standard consumer photos, these assets often include clinical data figures, molecular chemical structures, and official manufacturer packaging layouts.

As provided by Celgene Corporation, these visuals offer a comprehensive scientific overview of the product's physical and chemical identity, aiding pharmacists and researchers in product verification and study.

FDA Label Image

Inrebic-chem-structure (Image 01)

Inrebic-chem-structure (Image 01)
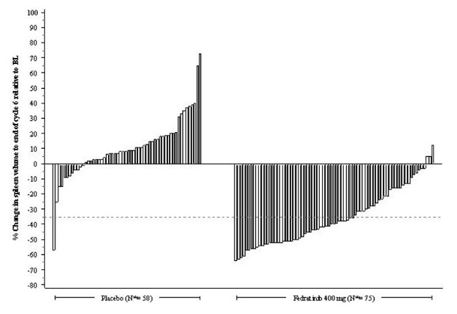
A bar chart comparing percentage changes in spleen volume at 24 weeks relative to baseline between placebo and Fedratinib 400 mg groups. The x-axis separates the two groups with sample sizes noted, and the y-axis shows percentage changes ranging roughly from -80% to +100%. Bars for the placebo group vary mostly above and below zero, while those for the Fedratinib group show predominantly negative percentage changes.*
FDA Label Image

Inrebic-figure-1 (Inrebic Figure 1)

Inrebic-figure-1 (Inrebic Figure 1)
A bar chart displaying the percentage change in bone volume to total volume in cancellous bone as a measure of drug effect. The chart compares two groups: Placebo (N=58) and Fedratinib 400 mg (N=75). The x-axis differentiates the groups, while the y-axis shows the percentage change from baseline, ranging from -80% to +100%. Bars for the placebo group mostly show positive changes, while those for the Fedratinib group show mostly negative changes.*
FDA Label Image

Inrebic-figure-2 (Inrebic Figure 2)

Inrebic-figure-2 (Inrebic Figure 2)
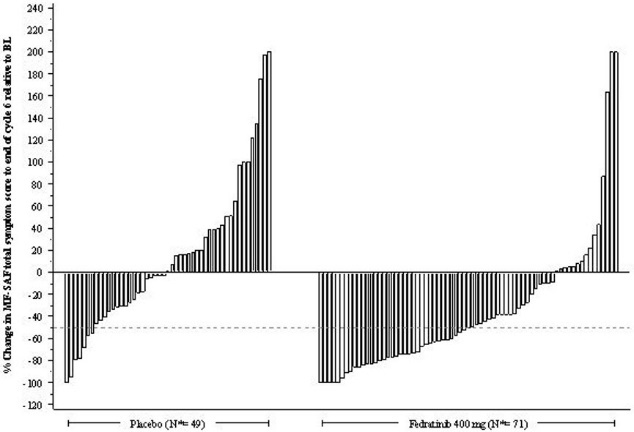
A bar chart comparing the percentage change in MPN-SAF total symptom score from baseline to the end of cycle 6 between two groups: Placebo (N=49) and Fedratinib 400 mg (N=71). The x-axis shows the two groups, and the y-axis represents percentage change, ranging approximately from -120% to +240%, with individual bars indicating varied symptom score changes within each group.*
FDA Label Image

Inrebic-figure-3 (Inrebic Figure 3)

Inrebic-figure-3 (Inrebic Figure 3)
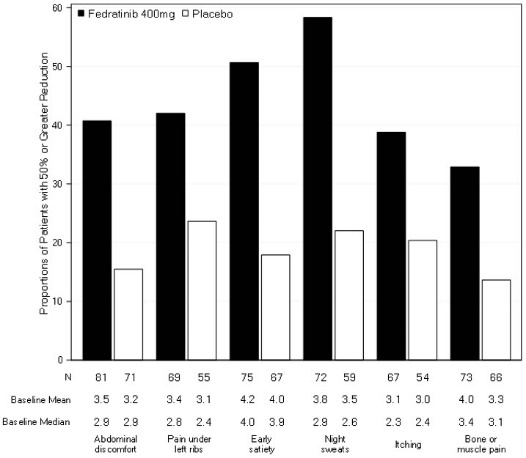
A bar chart comparing the proportion of patients with 50% or greater reduction in symptoms between Fedratinib 400 mg and placebo groups across various symptom categories. Categories include abdominal discomfort, pain under left ribs, early satiety, night sweats, itching, and bone or muscle pain. Bars for Fedratinib 400 mg are consistently higher than placebo in all categories, with baseline mean and median values provided below the bars.*
FDA Label Image

Inrebic-label (Inrebic Label)

Inrebic-label (Inrebic Label)
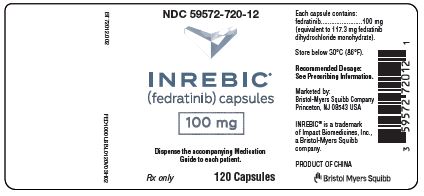
The label for Inrebic (fedratinib) capsules shows a strength of 100 mg per capsule in an oral dosage form. The package contains 120 capsules and is labeled for prescription use only. It is marketed by Bristol-Myers Squibb Company with Celgene Corporation as the labeler. The label includes storage instructions and a barcode.*

* About these descriptions: Image descriptions on this page are generated by automated AI analysis of the product label images from the manufacturer's FDA label submission (SPL). They are provided for reference only and may contain errors or omissions. Always rely on the printed label itself and the official FDA labeling, and consult a pharmacist or healthcare professional with any questions about this product.