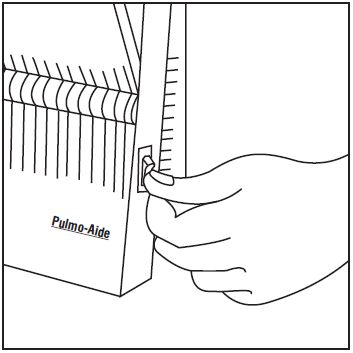
Product Images Tobramycin

View Photos of Packaging, Labels & Appearance

Product Label Images

The following 21 images provide visual information about the product associated with Tobramycin NDC 60687-731 by American Health Packaging, such as packaging, labeling, and the appearance of the drug itself. This resource could be helpful for medical professionals, pharmacists, and patients seeking to verify medication information and ensure they have the correct product.

Figure A - Figure A

Figure A - Figure A

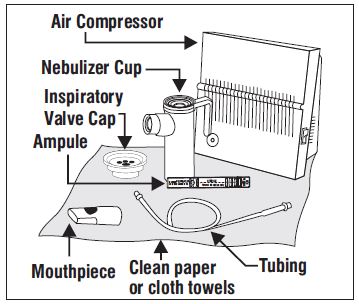
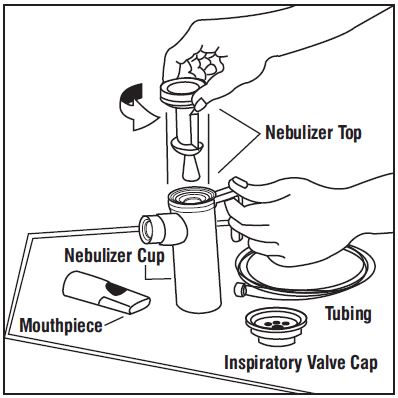
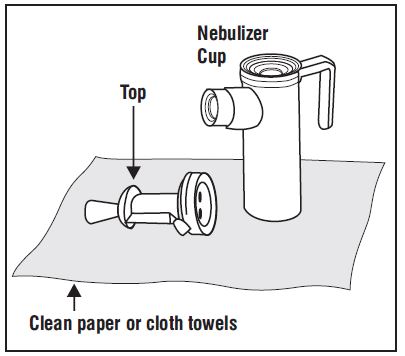
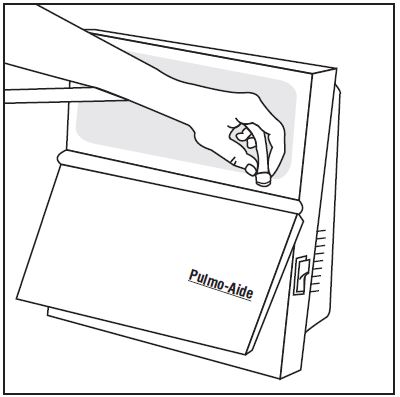
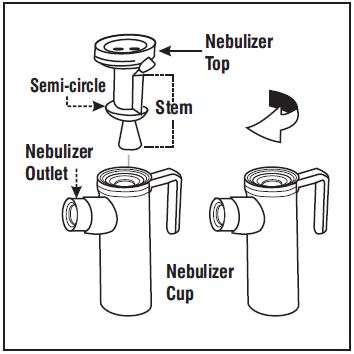
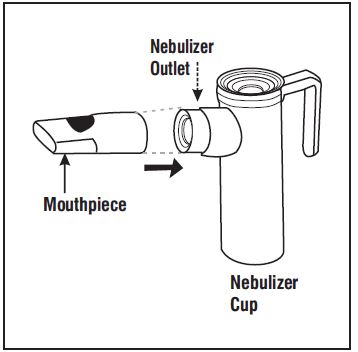
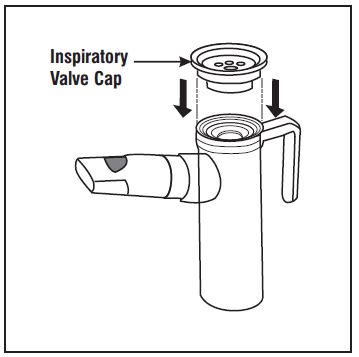
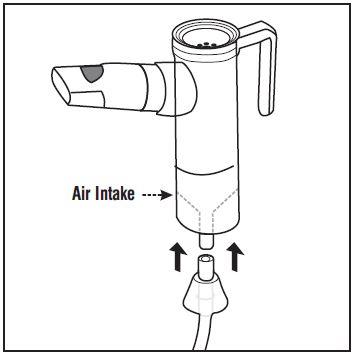
This text appears to be a list of items related to an air compressor. It mentions an SR nebulizer cup, an inspiratory valve cap, a mouthpiece, and clean paper tubing or cloth towels. These items might be used for cleaning or maintaining the air compressor.*

Figure B - Figure B

Figure B - Figure B

Figure C - Figure C

Figure C - Figure C

Figure D - Figure D

Figure D - Figure D

This is a description for a Nebulizer Cup.*

Figure E - Figure E

Figure E - Figure E

Figure F - Figure F

Figure F - Figure F

Figure G - Figure G

Figure G - Figure G

Figure H - Figure H

Figure H - Figure H

Figure I - Figure I

Figure I - Figure I

Figure J - Figure J

Figure J - Figure J

Figure K - Figure K

Figure K - Figure K

The text is not available.*

Figure L - Figure L

Figure L - Figure L

Figure M - Figure M

Figure M - Figure M

Figure N - Figure N

Figure N - Figure N

Figure O - Figure O

Figure O - Figure O

Figure P - Figure P

Figure P - Figure P

Structural Formula - Structure 01

Structural Formula - Structure 01

300 mg/5 mL Tobramycin Inhalation Solution Carton - Tobramycin Inhalation Solution Carton

300 mg/5 mL Tobramycin Inhalation Solution Carton - Tobramycin Inhalation Solution Carton

300 mg/5 mL Tobramycin Inhalation Solution Foil Pouch - Tobramycin Inhalation Solution Foil Pouch

300 mg/5 mL Tobramycin Inhalation Solution Foil Pouch - Tobramycin Inhalation Solution Foil Pouch

Figure 2: Absolute Change From Baseline in Log10 CFUs - figure 2

Figure 2: Absolute Change From Baseline in Log10 CFUs - figure 2

Figure 1: Relative Change From Baseline in FEV1 % Predicted - spl tobramycin figure

Figure 1: Relative Change From Baseline in FEV1 % Predicted - spl tobramycin figure

* The product label images have been analyzed using a combination of traditional computing and machine learning techniques. It should be noted that the descriptions provided may not be entirely accurate as they are experimental in nature. Use the information in this page at your own discretion and risk.