Orlistat Capsule
Product Images NDC 61269-565

View Photos of Packaging, Regulatory Labels, and Product Appearance

Product Visual Gallery

This gallery contains 6 technical images submitted to the FDA as part of the official labeling for Orlistat (NDC 61269-565). Unlike standard consumer photos, these assets often include clinical data figures, molecular chemical structures, and official manufacturer packaging layouts.

As provided by H2-pharma Llc, these visuals offer a comprehensive scientific overview of the product's physical and chemical identity, aiding pharmacists and researchers in product verification and study.

FDA Label Image

Table 1 (Xenical 01)

Table 1 (Xenical 01)
A data table presenting body mass index (BMI) values corresponding to various heights (in feet and inches) and weights (in pounds). The table is organized with height in the first column and weight across the top row, providing BMI values at their intersections.*
FDA Label Image

Chemical Structure (Xenical 02)

Chemical Structure (Xenical 02)
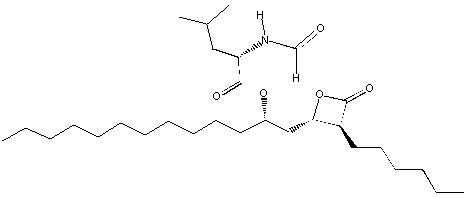
Chemical structure diagram of orlistat, showing its molecular formula representation with carbon chains, hydroxyl groups, and ester functionalities typical of the active ingredient orlistat.*
FDA Label Image

Figure 1 (Xenical 03)

Figure 1 (Xenical 03)
A scatter plot with a fitted curve depicting the relationship between Orlistat daily dose (mg) on the x-axis and fecal fat excretion (%) on the y-axis. Data points show variability in fecal fat excretion across doses ranging from 0 to 1200 mg.*
FDA Label Image

Figure 2 (Xenical 04)

Figure 2 (Xenical 04)
A line graph comparing mean change values with standard error between placebo and orlistat groups over a series of treatment days. The x-axis represents treatment days from 0 to 1530; the y-axis shows mean change values from 0 down to -11. Two lines track different responses: placebo with circles and orlistat with triangles. Both show an initial decline, with orlistat achieving a greater decrease, then a gradual increase over time.*
FDA Label Image

Figure 3 (Xenical 05)

Figure 3 (Xenical 05)
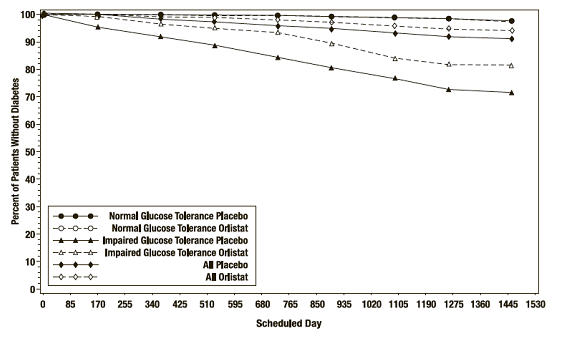
A line graph depicting the percent of patients without diabetes over scheduled days up to 1530 days. It compares normal and impaired glucose tolerance groups taking either placebo or orlistat, showing their diabetes-free survival percentages across time periods.*
FDA Label Image

Carton Detail (Xenical 06)

Carton Detail (Xenical 06)
Orlistat 120 mg capsules label showing the dosage strength prominently in green. The label states each capsule contains 120 mg orlistat and the package contains 90 capsules. Prescription only is indicated. The label includes logos for Chepla Pharm and H2 Pharma LLC, the labeler.*

* About these descriptions: Image descriptions on this page are generated by automated AI analysis of the product label images from the manufacturer's FDA label submission (SPL). They are provided for reference only and may contain errors or omissions. Always rely on the printed label itself and the official FDA labeling, and consult a pharmacist or healthcare professional with any questions about this product.