Figure 1 (Evkeeza 01)
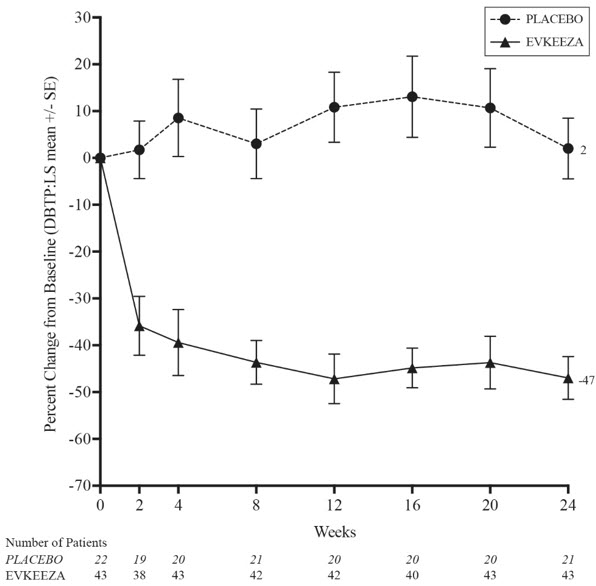
This appears to be a graph which shows "Percent change from Baseline" (DBTI) for two groups of patients - one who received a placebo and another who received a drug called EVKEEZA. The upper X-axis indicates the number of patients whereas the lower X-axis shows the duration of the treatment in weeks. However, due to the quality, the text is not very clear and some characters are missing or incorrectly recognized. Therefore, the interpretation might not be completely accurate.*