Gabapentin
Product Images NDC 61919-102

16 FDA label images from Direct Rx · Packaging, Regulatory Labels, and Product Appearance

Product Visual Gallery

This gallery contains 16 technical images submitted to the FDA as part of the official labeling for Gabapentin (NDC 61919-102). Unlike standard consumer photos, these assets often include clinical data figures, molecular chemical structures, and official manufacturer packaging layouts.

As provided by Direct Rx, these visuals offer a comprehensive scientific overview of the product's physical and chemical identity, aiding pharmacists and researchers in product verification and study.

FDA Label Image

Image Description (Figure)

Image Description (Figure)
A scatter plot chart showing differences in responder rates (%) versus daily dose (mg) of gabapentin. The graph compares results from three studies labeled as Study a, Study b, and Study c, with doses ranging approximately from 600 to 1800 mg.*

FDA Label Image

Image Description (Formula)

Image Description (Formula)
The image shows a formula to calculate creatinine clearance (CLCr), involving age, weight, serum creatinine, and a gender adjustment factor for female patients. This is a common clinical equation used in pharmacokinetics and dosing considerations.*
FDA Label Image

Image Description (Graph)

Image Description (Graph)
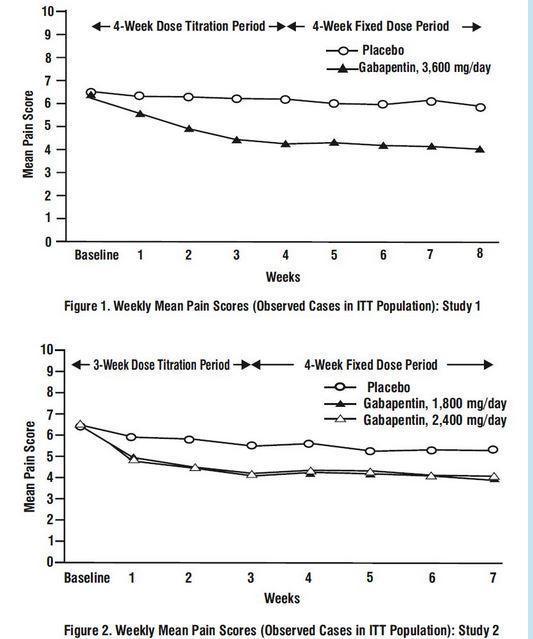
Two line graphs presenting weekly mean pain scores over time in patient populations from two studies. Figure 1 compares placebo versus Gabapentin at 3,600 mg/day across an 8-week period including a 4-week dose titration and 4-week fixed dose. Figure 2 compares placebo with Gabapentin at 1,800 mg/day and 2,400 mg/day over 7 weeks including a 3-week dose titration and 4-week fixed dose period.*
FDA Label Image

Image Description (Graph2)

Image Description (Graph2)
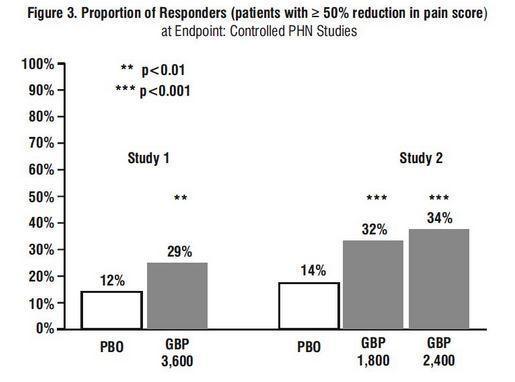
A bar graph showing the proportion of responders with at least 50% reduction in pain score at endpoint from two controlled PHN studies. Study 1 compares placebo (PBO) at 12% to gabapentin (GBP) 3,600 mg at 29%. Study 2 compares PBO at 14% to GBP 1,800 mg at 32% and GBP 2,400 mg at 34%. Statistical significance is noted with p-values <0.01 and <0.001.*
FDA Label Image

Image Description (Label)

Image Description (Label)
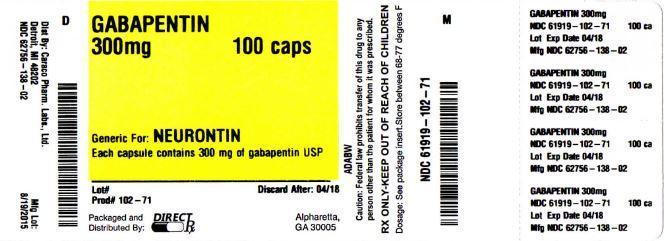
GABAPENTIN 300 mg, 100 capsules, packaged and distributed by Direct Rx, Alpharetta, GA. The label states it is a generic for NEURONTIN, each capsule contains 300 mg of gabapentin USP. It includes lot and expiration date information and cautions such as Rx only and keep out of reach of children.*
FDA Label Image

Image Description (Module)

Image Description (Module)
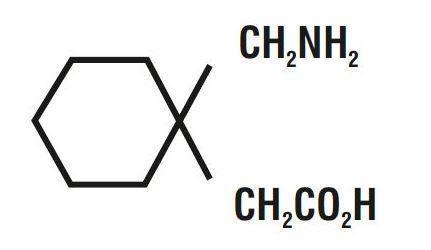
Chemical structure diagram of gabapentin, showing its cyclohexane ring with amino (CH2NH2) and carboxylic acid (CH2CO2H) functional groups.*
FDA Label Image

Image Description (Table1 1)

Image Description (Table1 1)
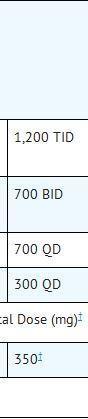
A data table showing different dosing regimens of a medication with quantities labeled as 1,200 TID, 700 BID, 700 QD, and 300 QD. The table includes a row labeled Total Dose (mg) with a value of 350.*
FDA Label Image

Image Description (Table1)

Image Description (Table1)
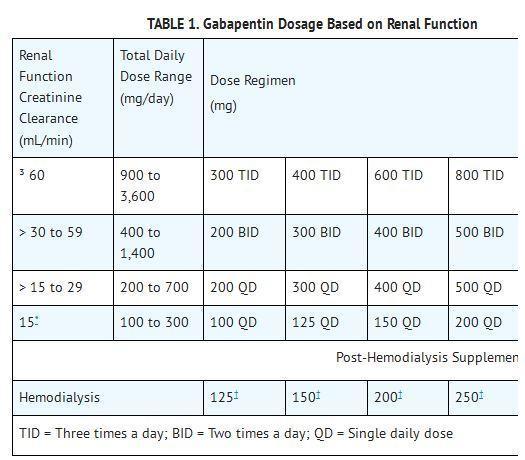
Table titled 'Gabapentin Dosage Based on Renal Function' displays dosing recommendations based on renal function creatinine clearance (mL/min). It includes total daily dose ranges (mg/day) and dose regimens in mg, categorized by renal clearance brackets from 15 mL/min to above 60 mL/min, plus post-hemodialysis supplemental doses. Abbreviations TID, BID, and QD correspond to dosing frequencies of three times a day, twice a day, and once daily, respectively.*
FDA Label Image

Image Description (Table2 1)

Image Description (Table2 1)
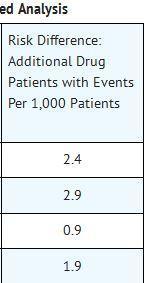
A data table titled 'Risk Difference: Additional Drug Patients with Events Per 1,000 Patients' presenting numerical values 2.4, 2.9, 0.9, and 1.9 in a vertical sequence.*
FDA Label Image

Image Description (Table2)

Image Description (Table2)
A data table titled 'Risk by Indication for Antiepileptic Drugs in the Pooled.' It presents the incidence of events per 1,000 patients in placebo and drug patient groups across indications including epilepsy, psychiatric, and other, along with relative risk values comparing drug to placebo patients.*
FDA Label Image

Image Description (Table3 2)

Image Description (Table3 2)
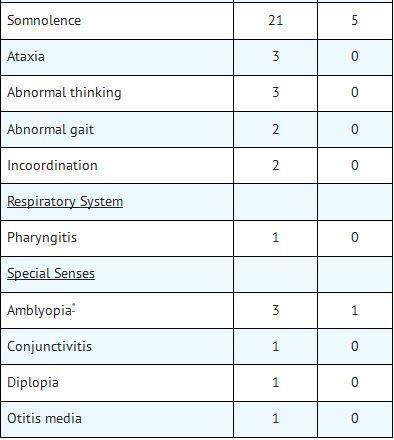
A table listing adverse events associated with gabapentin use, categorized by symptom type such as somnolence, ataxia, abnormal thinking, abnormal gait, incoordination, respiratory system issues like pharyngitis, and special senses including amblyopia, conjunctivitis, diplopia, and otitis media.*
FDA Label Image

Image Description (Table3)

Image Description (Table3)
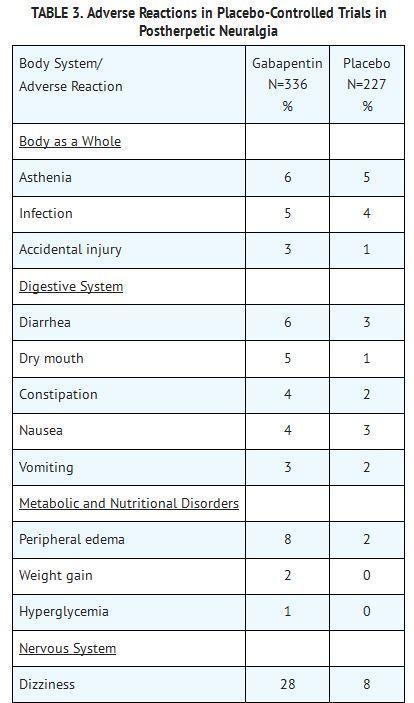
A data table titled 'Adverse Reactions in Placebo-Controlled Trials in Postherpetic Neuralgia' comparing adverse reaction rates between Gabapentin (N=336) and placebo (N=227). Body system categories include Body as a Whole, Digestive System, Metabolic and Nutritional Disorders, and Nervous System. Percentages for adverse reactions such as asthenia, infection, diarrhea, dry mouth, constipation, nausea, vomiting, peripheral edema, weight gain, hyperglycemia, and dizziness are listed for each group.*
FDA Label Image

Image Description (Table4 1)

Image Description (Table4 1)
A data table presenting adverse event frequencies associated with the drug Gabapentin by organ system and specific symptoms, such as nervous system effects (e.g., tremor, dysarthria, amnesia), respiratory system effects (e.g., pharyngitis, coughing), skin and appendages, urogenital system, and special senses (e.g., diplopia, amblyopia). Numbers indicate reported cases, with footnotes on background therapy and symptom descriptions.*
FDA Label Image

Image Description (Table4)

Image Description (Table4)
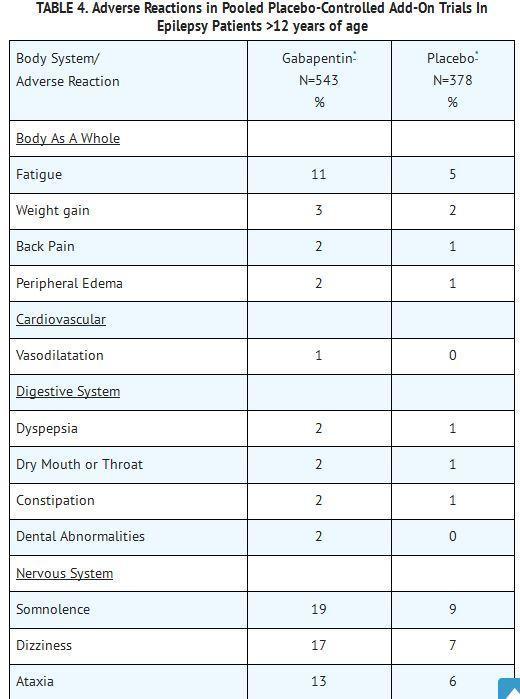
A table titled 'Adverse Reactions in Pooled Placebo-Controlled Add-On Trials in Epilepsy Patients >12 years of age' comparing the percentage incidence of various adverse reactions between Gabapentin (N=543) and Placebo (N=378). Adverse reactions are categorized by body system, including fatigue, weight gain, back pain, peripheral edema, vasodilatation, dyspepsia, dry mouth or throat, constipation, dental abnormalities, somnolence, dizziness, and ataxia.*
FDA Label Image

Image Description (Table5)

Image Description (Table5)
A data table showing adverse reactions in pediatric epilepsy patients aged 3 to 12 years in a placebo-controlled add-on trial comparing Gabapentin (N=119) and placebo (N=128). The table categorizes reactions by body system and lists the percentage occurrence for each group, including body as a whole effects, digestive and nervous system effects, and respiratory system effects.*
FDA Label Image

Image Description (Table6)

Image Description (Table6)
A data table titled 'TABLE 6. Controlled PHN Studies: Duration, Dosages, and Number of Patients' summarizing two studies with information on study duration, gabapentin target dose in mg/day, and number of patients receiving gabapentin and placebo. The table includes a note that dosages are given in three divided doses (TID).*

* About these descriptions: Image descriptions on this page are generated by automated AI analysis of the product label images from the manufacturer's FDA label submission (SPL). They are provided for reference only and may contain errors or omissions. Always rely on the printed label itself and the official FDA labeling, and consult a pharmacist or healthcare professional with any questions about this product.