Levetiracetam
Product Images NDC 64725-1130

View Photos of Packaging, Regulatory Labels, and Product Appearance

Product Visual Gallery

This gallery contains 9 technical images submitted to the FDA as part of the official labeling for Levetiracetam (NDC 64725-1130). Unlike standard consumer photos, these assets often include clinical data figures, molecular chemical structures, and official manufacturer packaging layouts.

As provided by Tya Pharmaceuticals, these visuals offer a comprehensive scientific overview of the product's physical and chemical identity, aiding pharmacists and researchers in product verification and study.

FDA Label Image

Label Image (64725 1130)
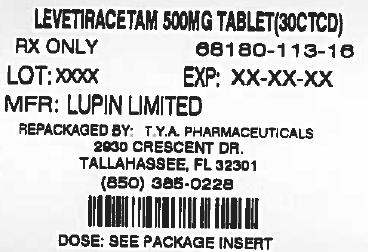
Label Image (64725 1130)
Label for Levetiracetam 500 mg tablet, indicated for repackaging by TYA Pharmaceuticals, located at 2930 Crescent Dr., Tallahassee, FL. The original manufacturer is Lupin Limited. The label includes a barcode and placeholders for lot number and expiration date, along with directions to see the package insert for dosage information.*

FDA Label Image

Image 0 (Levetiracetamtabletscombi Figure 01)

Image 0 (Levetiracetamtabletscombi Figure 01)
A formula panel illustrating the calculation of total daily dose (mL/day) of Levetiracetam, showing the equation as daily dose (mg/kg/day) multiplied by patient weight (kg), divided by 100 mg/mL concentration.*
FDA Label Image

Image 1 (Levetiracetamtabletscombi Figure 02)

Image 1 (Levetiracetamtabletscombi Figure 02)
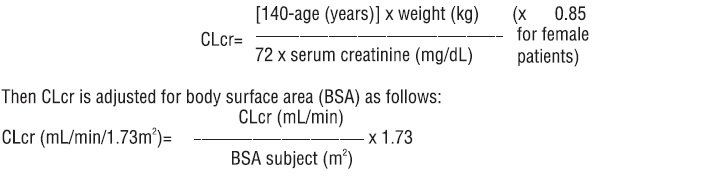
A text panel showing formulas for calculating creatinine clearance (CLcr). It includes the Cockcroft-Gault equation adjusted for female patients and a subsequent adjustment of CLcr based on body surface area (BSA), expressed with the relevant mathematical relationships and units.*
FDA Label Image

Image 2 (Levetiracetamtabletscombi Figure 03)

Image 2 (Levetiracetamtabletscombi Figure 03)
Chemical structure of levetiracetam showing atomic bonds and ring structures, including a pyrrolidone ring attached to an amide and alkyl side chain.*
FDA Label Image

Image 3 (Levetiracetamtabletscombi Figure 04)

Image 3 (Levetiracetamtabletscombi Figure 04)
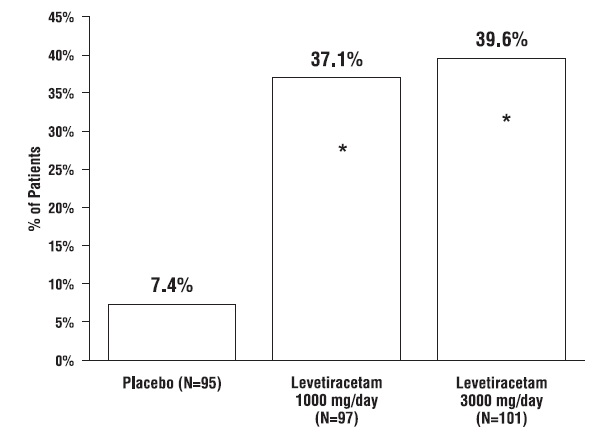
A bar chart comparing the percentage of patients across three groups: Placebo (7.4% of 95 patients), Levetiracetam 1000 mg/day (37.1% of 97 patients), and Levetiracetam 3000 mg/day (39.6% of 101 patients). Percentage of patients is shown on the Y-axis from 0% to 45%, with an asterisk above the Levetiracetam bars.*
FDA Label Image

Image 4 (Levetiracetamtabletscombi Figure 05)

Image 4 (Levetiracetamtabletscombi Figure 05)
A vertical bar chart comparing the percentage of patients among three groups: placebo (6.3%), Levetiracetam 1000 mg/day (20.8%), and Levetiracetam 2000 mg/day (35.2%). The chart includes sample sizes for each group and marks statistical significance with asterisks for the Levetiracetam groups.*
FDA Label Image

Image 5 (Levetiracetamtabletscombi Figure 06)

Image 5 (Levetiracetamtabletscombi Figure 06)
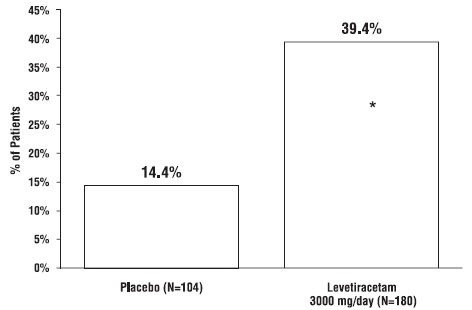
Bar chart comparing the percentage of patients between a placebo group (N=104) and a Levetiracetam 3000 mg/day group (N=180). The y-axis represents the percentage of patients, with the placebo group at 14.4% and the Levetiracetam group at 39.4%. An asterisk indicates a notable difference in the Levetiracetam group.*
FDA Label Image

Image 6 (Levetiracetamtabletscombi Figure 07)

Image 6 (Levetiracetamtabletscombi Figure 07)
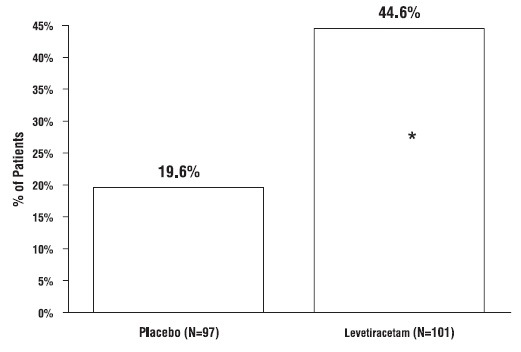
A bar chart comparing the percentage of patients for Placebo (19.6%) and Levetiracetam (44.6%). The y-axis represents the percentage of patients, ranging from 0% to 45%. The x-axis labels two groups: Placebo with 97 patients and Levetiracetam with 101 patients. A star symbol appears above the Levetiracetam bar.*
FDA Label Image

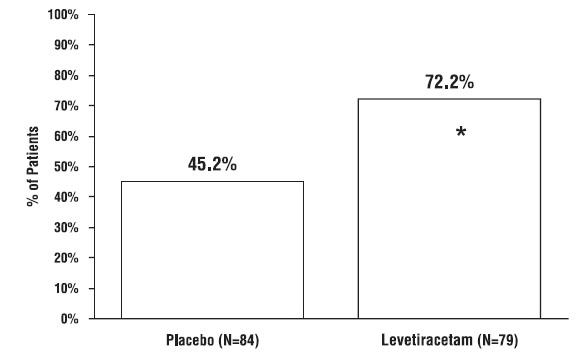
Image 7 (Levetiracetamtabletscombi Figure 08)

Image 7 (Levetiracetamtabletscombi Figure 08)
A bar chart comparing the percentage of patients between two groups: Placebo (N=84) and Levetiracetam (N=79). The y-axis represents the percentage of patients, ranging from 0% to 100%. The Placebo group shows 45.2%, while the Levetiracetam group shows 72.2%, marked with an asterisk above the bar.*

* About these descriptions: Image descriptions on this page are generated by automated AI analysis of the product label images from the manufacturer's FDA label submission (SPL). They are provided for reference only and may contain errors or omissions. Always rely on the printed label itself and the official FDA labeling, and consult a pharmacist or healthcare professional with any questions about this product.