Zontivity
Product Images NDC 66992-208

View Photos of Packaging, Regulatory Labels, and Product Appearance

Product Visual Gallery

This gallery contains 8 technical images submitted to the FDA as part of the official labeling for Zontivity (NDC 66992-208). Unlike standard consumer photos, these assets often include clinical data figures, molecular chemical structures, and official manufacturer packaging layouts.

As provided by Wraser Pharmaceuticals, Llc, these visuals offer a comprehensive scientific overview of the product's physical and chemical identity, aiding pharmacists and researchers in product verification and study.

FDA Label Image

Figure 1 (Zontivity 01)

Figure 1 (Zontivity 01)
A forest plot chart displaying subgroup analysis of hazard ratios with 95% confidence intervals for the drug ZONTIVITY compared to placebo across various categories such as sex, age, race, body weight, weight quartiles, primary enrollment stratum, renal insufficiency, geographic region, history of diabetes mellitus, history of heart failure, thienopyridine use at baseline, and aspirin use at baseline. The plot visually represents the effect size indicating whether ZONTIVITY or placebo is favored for each subgroup, accompanied by corresponding numerical data on total patients, number of events, and statistical values.*
FDA Label Image

Chemical Structure (Zontivity 02)

Chemical Structure (Zontivity 02)
Chemical structure of the active ingredient in ZONTIVITY by WraSer Pharmaceuticals, LLC. The diagram shows a complex molecular structure including a fluorophenyl and pyridine ring, ester and lactone groups, and a sulfate component.*
FDA Label Image

Figure 2 (Zontivity 03)

Figure 2 (Zontivity 03)
A forest plot chart showing the mean effect and 90% confidence intervals for various intrinsic factors on pharmacokinetic parameters AUC and Cmax of the drug. Factors include age, gender, weight, race, renal impairment, and hepatic impairment, with corresponding dose adjustment recommendations mostly indicating 'Not Needed' except for severe hepatic impairment marked as 'Use not recommended.' The horizontal axis represents change relative to reference values.*
FDA Label Image

Figure 3 (Zontivity 04)

Figure 3 (Zontivity 04)
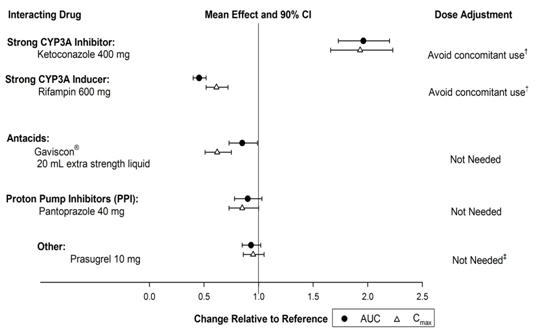
A line graph showing the mean effect and 90% confidence interval for area under the curve (AUC) and Cmax change relative to a reference, assessing dose adjustments required when ZONTIVITY is used with various interacting drugs, including a strong CYP3A4 inhibitor, strong CYP3A4 inducer, proton pump inhibitors, and others. The graph indicates 'not needed' or 'avoid concomitant use' instructions for each drug.*
FDA Label Image

Figure 4 (Zontivity 05)

Figure 4 (Zontivity 05)
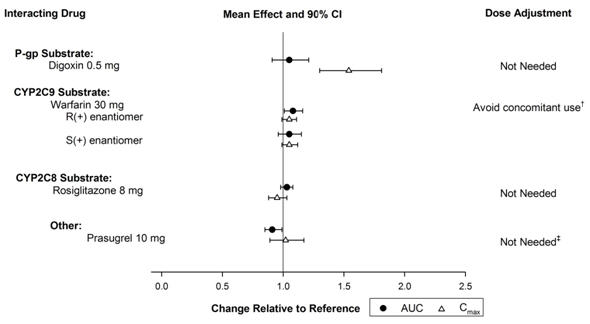
A scatter plot chart titled 'Mean Effect and 90% CI' showing the change relative to reference for different interacting drugs with ZONTIVITY. It displays drugs such as Digoxin, Warfarin (R and S enantiomers), Rosiglitazone, and Prasugrel, with markers for AUC and Cmax values and corresponding 90% confidence intervals. The chart includes recommended dose adjustments for each drug listed on the right.*
FDA Label Image

Figure 5 (Zontivity 06)

Figure 5 (Zontivity 06)
A line graph comparing the incidence (%) over 36 months from randomization between ZONTIVITY and placebo groups. The graph displays lower incidence for ZONTIVITY (10.1%) compared to placebo (11.8%). It includes numbers at risk at various time points and shows a hazard ratio (HR) of 0.83 with a 95% confidence interval (0.76, 0.90) and a p-value of less than 0.001.*
FDA Label Image

Figure 6 (Zontivity 07)

Figure 6 (Zontivity 07)
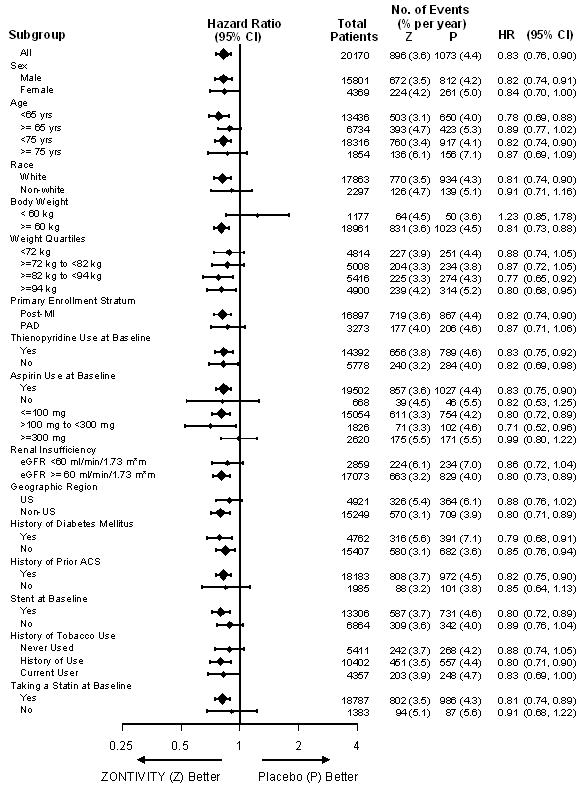
A forest plot chart showing hazard ratios with 95% confidence intervals for various patient subgroups in a clinical study of ZONTIVITY. The chart compares event rates between ZONTIVITY and placebo, displaying subgroups by sex, age, race, body weight, enrollment stratum, medication use, renal function, geographic region, diabetes history, ACS history, stent use, tobacco use, and statin use at baseline. Each subgroup has plotted hazard ratio points indicating treatment effect and confidence intervals on a logarithmic scale.*
FDA Label Image

Principal Display Panel (30 Tablet Bottle Label)

Principal Display Panel (30 Tablet Bottle Label)
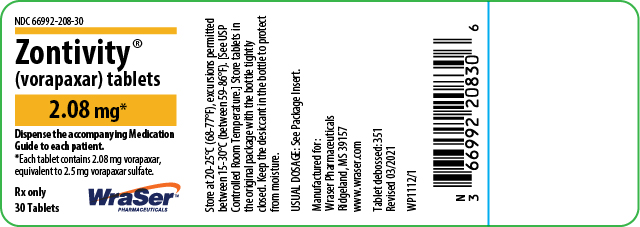
Zontivity (vorapaxar) tablets 2.08 mg, labeled as prescription only, in a package containing 30 tablets. The label includes storage instructions, a note to dispense the accompanying Medication Guide, and the manufacturer WraSer Pharmaceuticals, LLC. The label features the WraSer logo and relevant regulatory information including the product NDC 66992-208-30.*

* About these descriptions: Image descriptions on this page are generated by automated AI analysis of the product label images from the manufacturer's FDA label submission (SPL). They are provided for reference only and may contain errors or omissions. Always rely on the printed label itself and the official FDA labeling, and consult a pharmacist or healthcare professional with any questions about this product.