Figure 1 (Adderall 01)
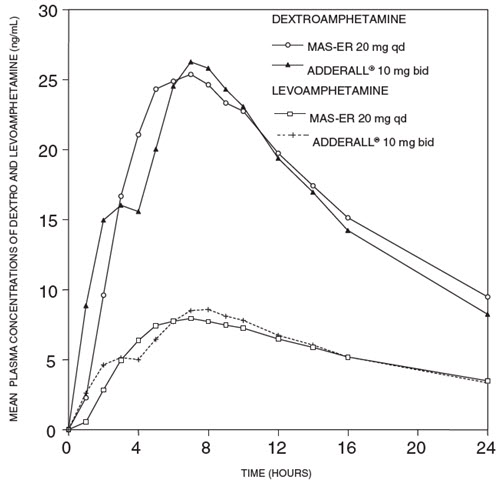
The text describes mean plasma concentrations of Dextroamphetamine and Levamphetamine in ng/mL for different dosages at various intervals of time, represented in a graph. The dosages include MAS-ER 20 mg ad, ADDERALL® 10 mg bid, and T MAS-ER 20mg qd. The time intervals are shown in hours, ranging from 12 to 24.*