Divalproex Sodium
Product Images NDC 67046-121

View Photos of Packaging, Regulatory Labels, and Product Appearance

Product Visual Gallery

This gallery contains 7 technical images submitted to the FDA as part of the official labeling for Divalproex Sodium (NDC 67046-121). Unlike standard consumer photos, these assets often include clinical data figures, molecular chemical structures, and official manufacturer packaging layouts.

As provided by Contract Pharmacy Services-pa, these visuals offer a comprehensive scientific overview of the product's physical and chemical identity, aiding pharmacists and researchers in product verification and study.

FDA Label Image

Chemical Structure (Ea1966a2 794c 434e A9da 57890bd182fc 01)

Chemical Structure (Ea1966a2 794c 434e A9da 57890bd182fc 01)
Chemical structure diagram of divalproex sodium showing the molecular arrangement, including carbon chains, sodium ions, and functional groups.*
FDA Label Image

Figure 1 (Ea1966a2 794c 434e A9da 57890bd182fc 02)

Figure 1 (Ea1966a2 794c 434e A9da 57890bd182fc 02)
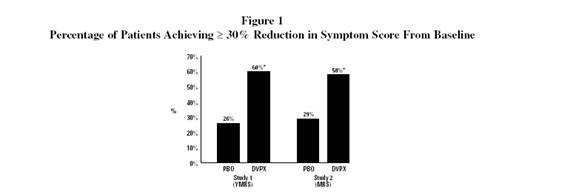
A bar chart titled "Percentage of Patients Achieving ≥ 30% Reduction in Symptom Score From Baseline" showing two studies comparing placebo (PBO) and Divalproex Sodium (DVPX). The chart illustrates higher percentage reductions in symptom scores for Divalproex Sodium groups compared to placebo in both studies.*
FDA Label Image

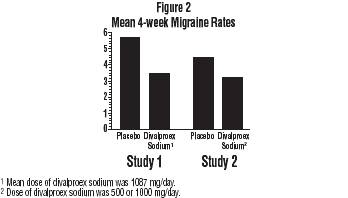
Figure 2 (Ea1966a2 794c 434e A9da 57890bd182fc 03)

Figure 2 (Ea1966a2 794c 434e A9da 57890bd182fc 03)
A bar graph titled 'Figure 2 Mean 4-week Migraine Rates' comparing migraine rates between placebo and divalproex sodium groups in two separate studies. The vertical axis shows frequency of migraines, and the graph includes notes on dosing for divalproex sodium in each study.*
FDA Label Image

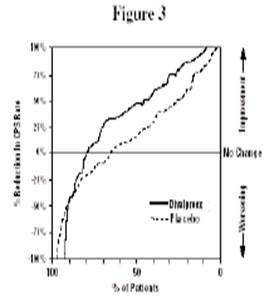
Figure 3 (Ea1966a2 794c 434e A9da 57890bd182fc 04)

Figure 3 (Ea1966a2 794c 434e A9da 57890bd182fc 04)
Figure 3 is a cumulative distribution plot depicting the reduction in CPS Rate among patients. The graph compares two groups: Divalproex (solid line) and Placebo (dashed line). The y-axis represents the reduction in CPS Rate from -100% to 100%, with 0% indicating no change. The x-axis shows the percentage of patients.*
FDA Label Image

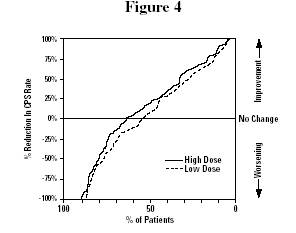
Figure 4 (Ea1966a2 794c 434e A9da 57890bd182fc 05)

Figure 4 (Ea1966a2 794c 434e A9da 57890bd182fc 05)
Figure 4 displays a line graph comparing the percentage reduction in GSR Rate against the percentage of patients for high dose versus low dose treatments. The Y-axis represents the improvement scale, ranging from worsening to improvement, and the X-axis represents the percentage of patients, demonstrating the relative effectiveness of the two dose levels.*
FDA Label Image

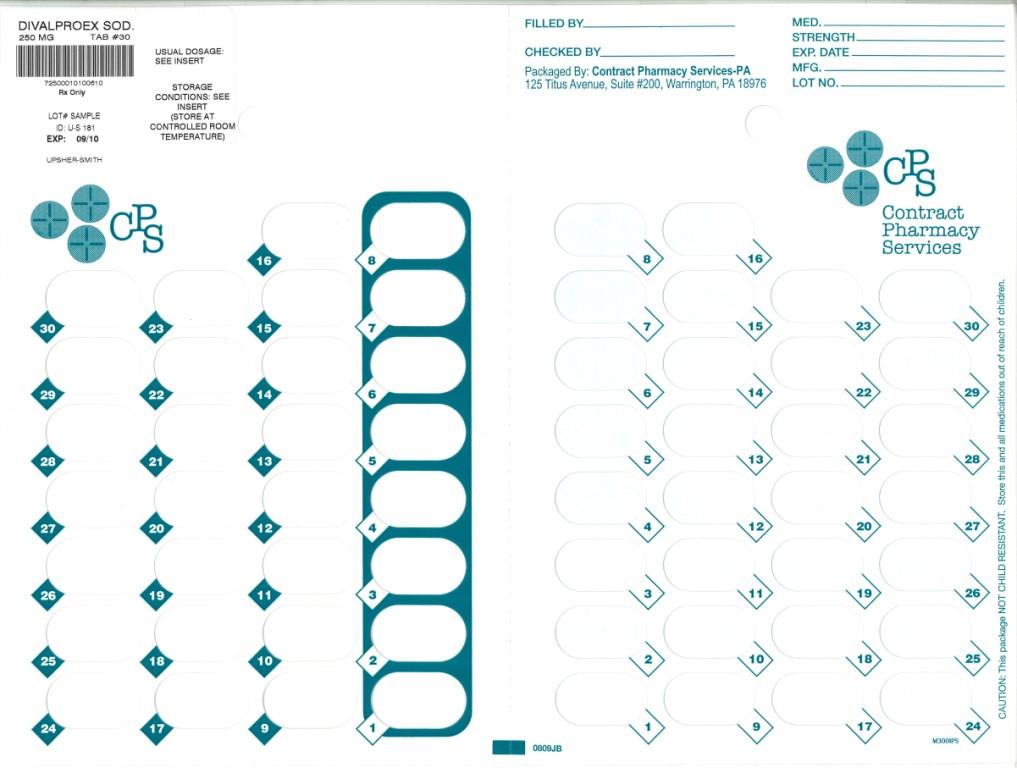
250 mg Tablets (Ea1966a2 794c 434e A9da 57890bd182fc 06)

250 mg Tablets (Ea1966a2 794c 434e A9da 57890bd182fc 06)
Divalproex Sodium 250 mg tablet packaging label from Contract Pharmacy Services-PA. The label includes dosage unit count of 30 tablets, a barcode, storage conditions specifying controlled room temperature, and spaces for pharmacy filling information. The label features a calendar-style layout with numbered days from 1 to 30 for medication tracking.*
FDA Label Image

500 mg Tablets (Ea1966a2 794c 434e A9da 57890bd182fc 07)

500 mg Tablets (Ea1966a2 794c 434e A9da 57890bd182fc 07)
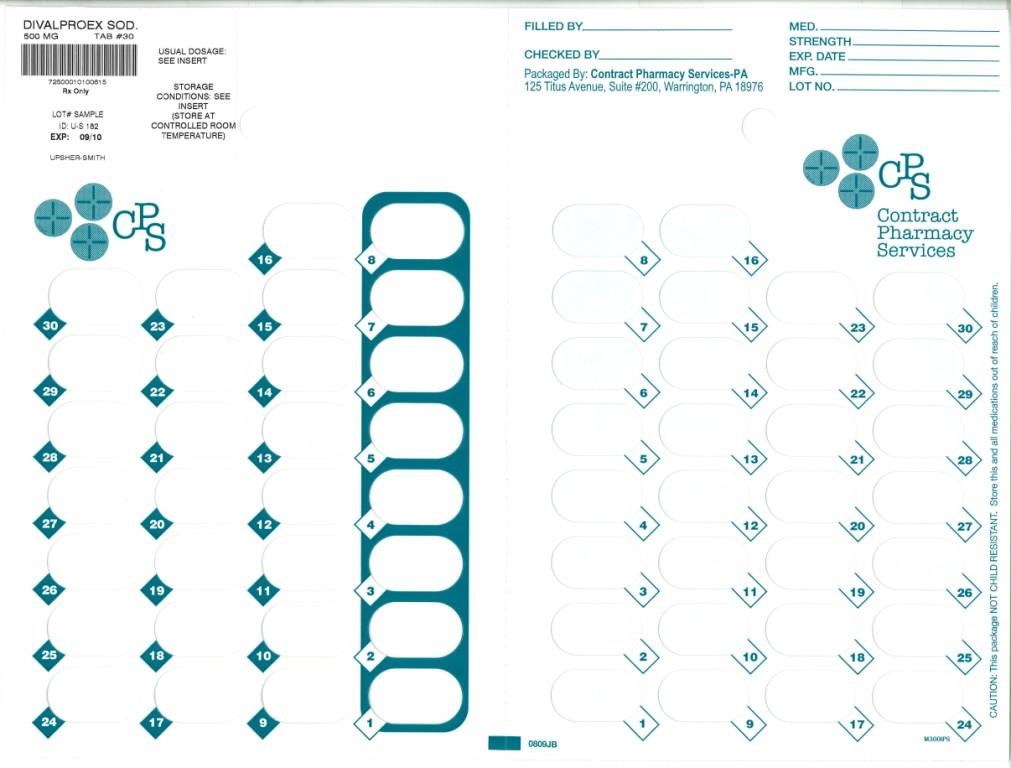
Divalproex Sodium 500 mg tablet packaging label from Contract Pharmacy Services-PA, showing a 30-tablet calendar dose pack. The label includes storage instructions, barcode, lot and expiration date, and spaces for pharmacy filling and medication details. The pharmacy's address in Warrington, PA is printed, alongside the CPS logo.*

* About these descriptions: Image descriptions on this page are generated by automated AI analysis of the product label images from the manufacturer's FDA label submission (SPL). They are provided for reference only and may contain errors or omissions. Always rely on the printed label itself and the official FDA labeling, and consult a pharmacist or healthcare professional with any questions about this product.