Figure (Levo Ethi Fig1)
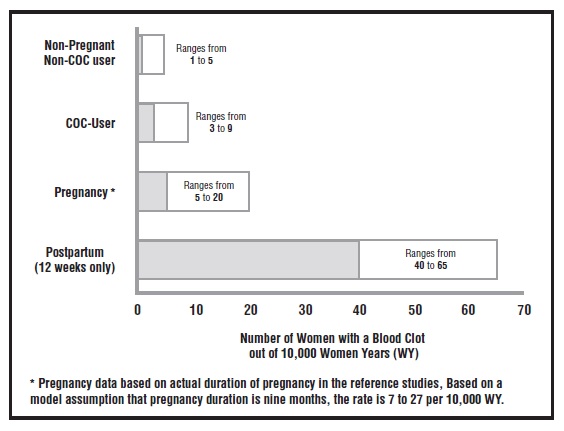
This is a chart showing information related to pregnancy risk in different groups of women. It mentions that the data is specific for non-pregnant, non-COC users, COC users, and postpartum women. It provides blood clot incidence per 10,000 women years for each group, with a specific note about pregnancy data based on actual duration. The available information includes ranges and specific numbers related to the risk of blood clots in these different categories of women.*