Sumatriptan Succinate
Product Images NDC 68151-1658

View Photos of Packaging, Regulatory Labels, and Product Appearance

Product Visual Gallery

This gallery contains 4 technical images submitted to the FDA as part of the official labeling for Sumatriptan Succinate (NDC 68151-1658). Unlike standard consumer photos, these assets often include clinical data figures, molecular chemical structures, and official manufacturer packaging layouts.

As provided by Carilion Materials Management, these visuals offer a comprehensive scientific overview of the product's physical and chemical identity, aiding pharmacists and researchers in product verification and study.

FDA Label Image

Label Image (68151 1658)

Label Image (68151 1658)
Label for sumatriptan succinate containing 25 mg tablets. The label shows the lot number, expiration date, and manufacturer information. It is marked with the product NDC 68151-1658 and includes a barcode. The label specifies 'RX ONLY' indicating the product requires a prescription.*
FDA Label Image

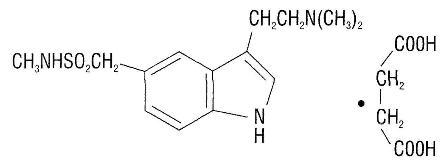
Chemical-structure (Chemical Structure)

Chemical-structure (Chemical Structure)
Chemical structure of sumatriptan succinate showing the molecular arrangement associated with this active ingredient.*
FDA Label Image

Sumatriptan-figure-1 (Sumatriptan Figure 1)

Sumatriptan-figure-1 (Sumatriptan Figure 1)
A Kaplan-Meier plot showing the estimated probability of achieving an initial headache response within 4 hours after treatment over time. The graph compares placebo and oral sumatriptan doses of 25 mg, 50 mg, and 100 mg, with the y-axis representing estimated probability of response (0-100%) and the x-axis representing time in minutes from initial dose (0-240 minutes). Data are from pooled clinical trials on oral sumatriptan efficacy.*
FDA Label Image

Sumatriptan-figure-2 (Sumatriptan Figure 2)

Sumatriptan-figure-2 (Sumatriptan Figure 2)
A Kaplan-Meier plot showing the estimated probability of patients taking a second dose of sumatriptan succinate tablets or other medication to treat migraine over 24 hours after the initial dose in pooled clinical trials. The plot compares placebo, 25 mg, 50 mg, and 100 mg doses, with probability on the y-axis and time in hours from the initial dose on the x-axis.*

* About these descriptions: Image descriptions on this page are generated by automated AI analysis of the product label images from the manufacturer's FDA label submission (SPL). They are provided for reference only and may contain errors or omissions. Always rely on the printed label itself and the official FDA labeling, and consult a pharmacist or healthcare professional with any questions about this product.