Tramadol Hydrochloride
Product Images NDC 68258-2003

View Photos of Packaging, Regulatory Labels, and Product Appearance

Product Visual Gallery

This gallery contains 6 technical images submitted to the FDA as part of the official labeling for Tramadol Hydrochloride (NDC 68258-2003). Unlike standard consumer photos, these assets often include clinical data figures, molecular chemical structures, and official manufacturer packaging layouts.

As provided by Dispensing Solutions, Inc., these visuals offer a comprehensive scientific overview of the product's physical and chemical identity, aiding pharmacists and researchers in product verification and study.

FDA Label Image

Ndc 68258-2003-03 (Ndc 68258 2003 03 Par)

Ndc 68258-2003-03 (Ndc 68258 2003 03      Par)
Label for TRAMADOL HCl ER 200 mg extended-release tablets, containing 30 tablets. The label includes the NDC 68258-2003-03, product number 2T0130, and warnings about habit-forming potential. It also displays labeler information as Dispensing Solutions, Inc., Santa Ana, CA. Additional details include sample lot and expiration placeholders and storage instructions.*
FDA Label Image

This Is Figure 2a (Fig2a)

This Is Figure 2a (Fig2a)
A line graph depicting plasma concentration (ng/mL) of Tramadol over time (hours) for two tablet dosages: 200 mg and 50 mg. The x-axis represents time in hours, and the y-axis represents plasma concentration. The graph compares the pharmacokinetic profiles of the two dosage strengths.*
FDA Label Image

This Is Fig 2b (Fig2b)

This Is Fig 2b (Fig2b)
A line graph comparing the plasma concentration of Tramadol Hydrochloride tablets at 200 mg and 50 mg doses over a 24-hour period. The x-axis represents time in hours, and the y-axis shows plasma concentration levels in ng/mL. The graph includes data points connected by lines for both dosage strengths.*
FDA Label Image

Figure3 (Fig3)

Figure3 (Fig3)
A line graph titled 'Tramadol HCl ER Tablets Study 023 WOMAC Pain Responder Analysis' showing the percent of patients achieving various response thresholds, measured as percent improvement from baseline. The graph compares Tramadol HCl ER Tablets at doses of 100 mg, 200 mg, 300 mg, and 400 mg versus placebo.*
FDA Label Image

Figure4 (Fig4)

Figure4 (Fig4)
A line graph titled 'Tramadol HCl ER Tablets Study 015 Arthritis Intensity VAS Responder Analysis' comparing the percentage of patients achieving various levels of response threshold between Tramadol HCl ER Tablets and placebo groups. The x-axis represents response thresholds as percent improvement from baseline, and the y-axis shows the percent of patients achieving the response. Two lines illustrate the differences in responder rates between the treatment and placebo over increasing thresholds.*
FDA Label Image

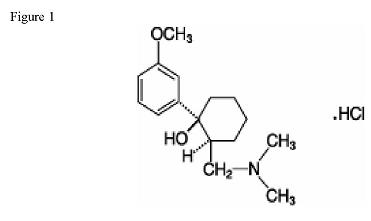
Structure (Structure)

Structure (Structure)
Chemical structure of tramadol hydrochloride showing its molecular components including a cyclohexane ring, methoxyphenyl group, hydroxyl group, and dimethylamino group attached to the side chain with the hydrochloride (HCl) salt.*

* About these descriptions: Image descriptions on this page are generated by automated AI analysis of the product label images from the manufacturer's FDA label submission (SPL). They are provided for reference only and may contain errors or omissions. Always rely on the printed label itself and the official FDA labeling, and consult a pharmacist or healthcare professional with any questions about this product.