Alfuzosin Hydrochloride Tablet
Product Images NDC 69097-844

14 FDA label images from Cipla Usa Inc. · Packaging, Regulatory Labels, and Product Appearance

Product Visual Gallery

This gallery contains 14 technical images submitted to the FDA as part of the official labeling for Alfuzosin Hydrochloride (NDC 69097-844). Unlike standard consumer photos, these assets often include clinical data figures, molecular chemical structures, and official manufacturer packaging layouts.

As provided by Cipla Usa Inc., these visuals offer a comprehensive scientific overview of the product's physical and chemical identity, aiding pharmacists and researchers in product verification and study.

FDA Label Image

Image (3fb33b8f 9ec4 4a4b A520 De154673cfb0 01)
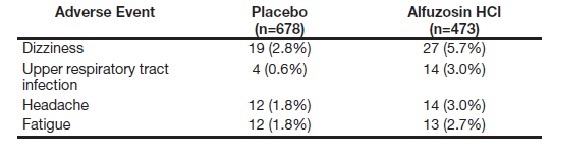
Image (3fb33b8f 9ec4 4a4b A520 De154673cfb0 01)
A data table comparing the incidence of select adverse events in patients receiving Placebo and Alfuzosin Hydrochloride (Alfuzosin HCl). Events listed include dizziness, upper respiratory tract infection, headache, and fatigue with corresponding percentages for each treatment group.*
FDA Label Image

Image (3fb33b8f 9ec4 4a4b A520 De154673cfb0 02)

Image (3fb33b8f 9ec4 4a4b A520 De154673cfb0 02)
A data table presenting symptom incidence rates comparing Placebo and Alfuzosin Hydrochloride (HCl) treatment groups, showing counts and percentages for dizziness, hypotension or postural hypotension, and syncope among participants.*
FDA Label Image

Image (3fb33b8f 9ec4 4a4b A520 De154673cfb0 03)

Image (3fb33b8f 9ec4 4a4b A520 De154673cfb0 03)
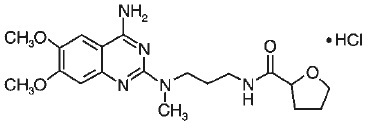
Chemical structure diagram of Alfuzosin Hydrochloride showing its molecular framework including rings, side chains, and the hydrochloride component, consistent with the active ingredient Alfuzosin Hydrochloride in the listed product.*
FDA Label Image

Image (3fb33b8f 9ec4 4a4b A520 De154673cfb0 04)

Image (3fb33b8f 9ec4 4a4b A520 De154673cfb0 04)
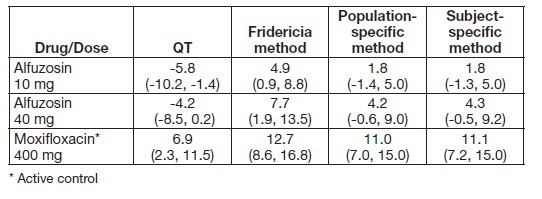
A data table comparing three drugs—Alfuzosin 10 mg, Alfuzosin 40 mg, and Moxifloxacin 400 mg (active control)—across four methods: QT, Fridericia method, Population-specific method, and Subject-specific method, with numerical values and ranges presented for each drug and method.*
FDA Label Image

Image (3fb33b8f 9ec4 4a4b A520 De154673cfb0 05)

Image (3fb33b8f 9ec4 4a4b A520 De154673cfb0 05)
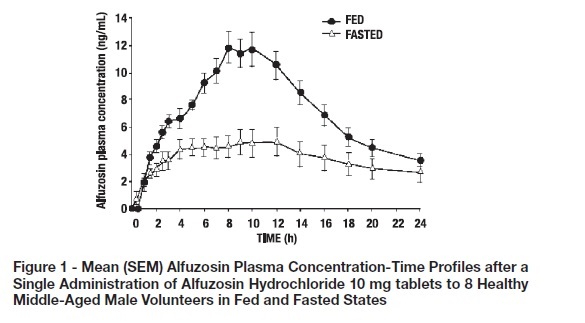
Line chart showing mean (SEM) plasma concentration of Alfuzosin over 24 hours after a single 10 mg oral dose in healthy middle-aged male volunteers. Two curves compare fed versus fasted states, plotting Alfuzosin plasma concentration (ng/mL) on the Y-axis and time (hours) on the X-axis.*
FDA Label Image

Image (3fb33b8f 9ec4 4a4b A520 De154673cfb0 06)

Image (3fb33b8f 9ec4 4a4b A520 De154673cfb0 06)
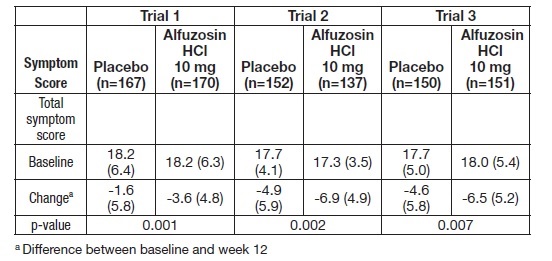
A data table presenting symptom scores from three clinical trials comparing Alfuzosin Hydrochloride 10 mg and placebo. Scores include baseline, change from baseline to week 12, and statistical p-values for each group across trials, illustrating the effect of Alfuzosin Hydrochloride versus placebo on symptom scores.*
FDA Label Image

Image (3fb33b8f 9ec4 4a4b A520 De154673cfb0 07)

Image (3fb33b8f 9ec4 4a4b A520 De154673cfb0 07)
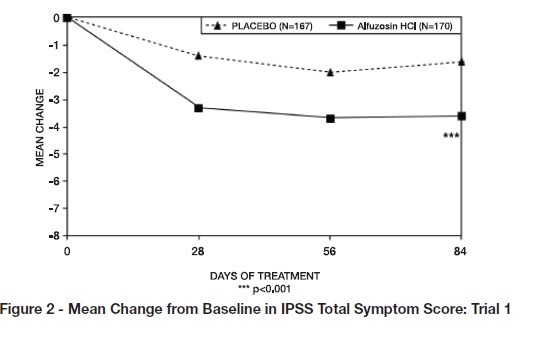
A line graph titled "Mean Change from Baseline in IPSS Total Symptom Score: Trial 1" showing mean symptom score change over 84 days of treatment. It compares Placebo (N=167) and Alfuzosin Hydrochloride (N=170), with Alfuzosin showing greater reduction in symptom scores, notably at day 84 with statistical significance indicated (p<0.001).*
FDA Label Image

Image (3fb33b8f 9ec4 4a4b A520 De154673cfb0 08)

Image (3fb33b8f 9ec4 4a4b A520 De154673cfb0 08)
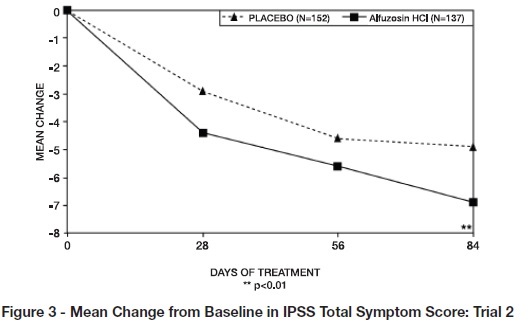
A line graph showing mean change from baseline in IPSS Total Symptom Score over treatment days (0, 28, 56, 84) comparing Placebo and Alfuzosin Hydrochloride groups. The y-axis represents mean change, with Alfuzosin showing greater symptom score reduction than placebo over time.*
FDA Label Image

Image (3fb33b8f 9ec4 4a4b A520 De154673cfb0 09)

Image (3fb33b8f 9ec4 4a4b A520 De154673cfb0 09)
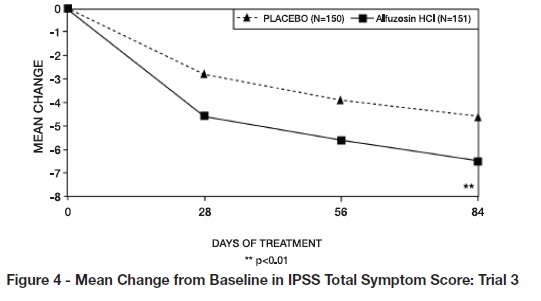
A line graph titled 'Mean Change from Baseline in IPSS Total Symptom Score: Trial 3' comparing placebo and Alfuzosin Hydrochloride treatment groups over 84 days. The x-axis represents days of treatment (0, 28, 56, 84) and the y-axis shows mean change values from 0 to -8. Two lines depict mean symptom score changes for placebo (triangle markers) and Alfuzosin Hydrochloride (square markers). Alfuzosin shows greater symptom reduction throughout the study period.*
FDA Label Image

Image (3fb33b8f 9ec4 4a4b A520 De154673cfb0 10)

Image (3fb33b8f 9ec4 4a4b A520 De154673cfb0 10)
A data table presenting mean peak flow rate scores comparing placebo and Alfuzosin Hydrochloride 10 mg across three clinical trials. The table includes baseline values, changes from baseline to week 12, and p-values indicating statistical significance.*
FDA Label Image

Image (3fb33b8f 9ec4 4a4b A520 De154673cfb0 11)

Image (3fb33b8f 9ec4 4a4b A520 De154673cfb0 11)
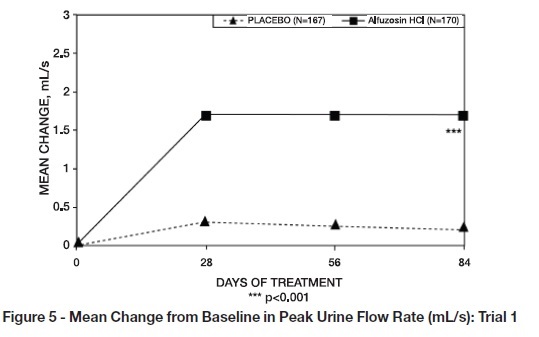
A line graph titled 'Figure 5 - Mean Change from Baseline in Peak Urine Flow Rate (ml/s): Trial 1' comparing mean changes over 84 days of treatment between placebo and Alfuzosin HCl groups. The y-axis shows mean change in ml/s, and the x-axis shows days of treatment. Alfuzosin HCl shows a significant increase in mean change from baseline compared to placebo, remaining stable from day 28 to day 84.*
FDA Label Image

Image (3fb33b8f 9ec4 4a4b A520 De154673cfb0 12)

Image (3fb33b8f 9ec4 4a4b A520 De154673cfb0 12)
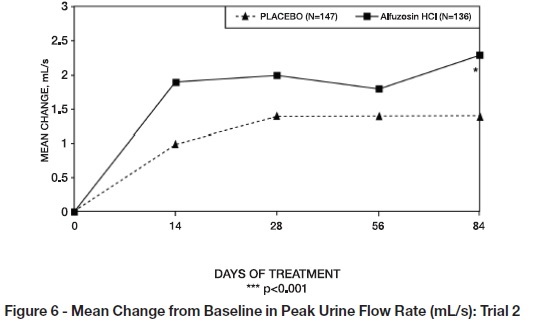
This line graph displays the mean change from baseline in peak urine flow rate (mL/s) over 84 days of treatment. It compares two groups: placebo (N=147) and Alfuzosin Hydrochloride (N=136). The x-axis represents days of treatment (0 to 84), and the y-axis shows mean change in mL/s. Data points indicate an increase in peak urine flow rate over time, with higher values observed in the Alfuzosin Hydrochloride group compared to placebo, highlighting treatment effects.*
FDA Label Image

Image (3fb33b8f 9ec4 4a4b A520 De154673cfb0 13)

Image (3fb33b8f 9ec4 4a4b A520 De154673cfb0 13)
A line graph titled 'Mean Change from Baseline in Peak Urine Flow Rate (mL/s): Trial 3' comparing the mean change in peak urine flow rate over 84 days of treatment between two groups: one receiving Alfuzosin Hydrochloride and the other a placebo. The graph shows data points for days 0, 14, 28, 56, and 84 with trend lines indicating a higher mean change in the Alfuzosin Hydrochloride group compared to placebo. The difference is not statistically significant (NS, p>0.05).*
FDA Label Image

Alfuzosin Hydrochloride 10mg

Alfuzosin Hydrochloride 10mg
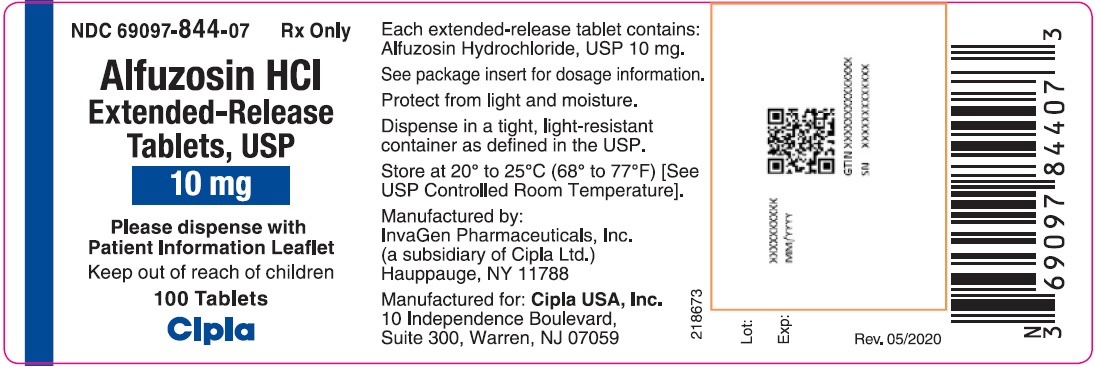
Label for Alfuzosin Hydrochloride extended-release tablets, USP 10 mg, oral dosage form. The label indicates 100 tablets per container and is for prescription use only. Manufactured by InvaGen Pharmaceuticals, a Cipla Ltd. subsidiary, and labeled for Cipla USA Inc. Storage and handling instructions, barcode, and QR code are also visible.*

* About these descriptions: Image descriptions on this page are generated by automated AI analysis of the product label images from the manufacturer's FDA label submission (SPL). They are provided for reference only and may contain errors or omissions. Always rely on the printed label itself and the official FDA labeling, and consult a pharmacist or healthcare professional with any questions about this product.