Rexulti Tablet
Product Images NDC 70518-4608

View Photos of Packaging, Regulatory Labels, and Product Appearance

Product Visual Gallery

This gallery contains 11 technical images submitted to the FDA as part of the official labeling for Rexulti (NDC 70518-4608). Unlike standard consumer photos, these assets often include clinical data figures, molecular chemical structures, and official manufacturer packaging layouts.

As provided by Remedyrepack Inc., these visuals offer a comprehensive scientific overview of the product's physical and chemical identity, aiding pharmacists and researchers in product verification and study.

FDA Label Image

Remedy_label (Remedy Label)
Remedy_label (Remedy Label)
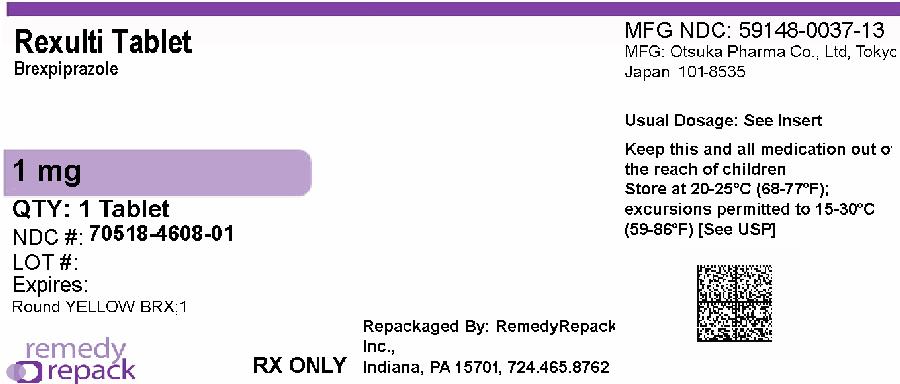
Rexulti 1 mg tablet packaging label showing brexpiprazole as the active ingredient. The label indicates one tablet quantity with NDC 70518-4608-01. It is repackaged by RemedyRepack Inc., Indiana, PA. Storage instructions and manufacturer details (Otsuka Pharma, Tokyo) are visible along with dosage advice to see insert.*
FDA Label Image

Mm1 (Rexulti 1mg 70518 4608 00)

Mm1 (Rexulti 1mg 70518 4608 00)
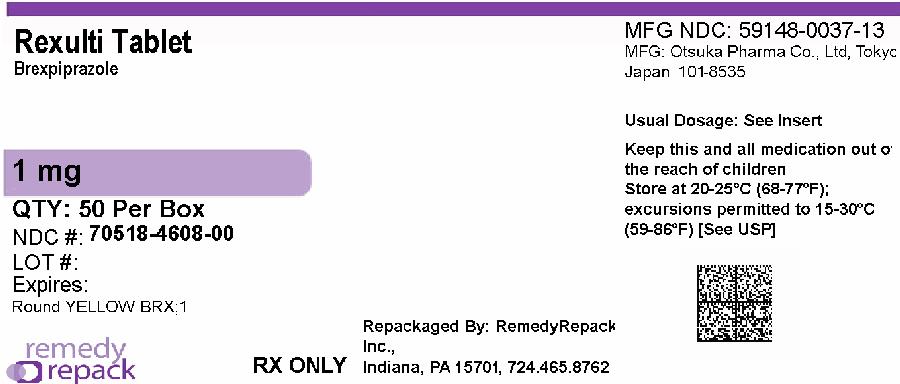
Rexulti Tablet 1 mg oral tablets label with a quantity of 50 per box, labeled by RemedyRepack Inc. The active ingredient is brexpiprazole. The label includes storage instructions, a QR code, and manufacturer information for Otsuka Pharma Co., Ltd., Tokyo, Japan. It also notes the product is RX only and displays the NDC number 70518-4608-00.*
FDA Label Image

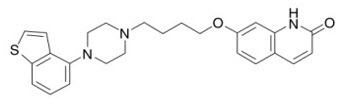
Chemical Structure (Rexulti 01)

Chemical Structure (Rexulti 01)
Chemical structure of brexpiprazole, the active ingredient in Rexulti. The diagram depicts the molecular composition with rings and bonds representing the compound's chemical framework.*
FDA Label Image

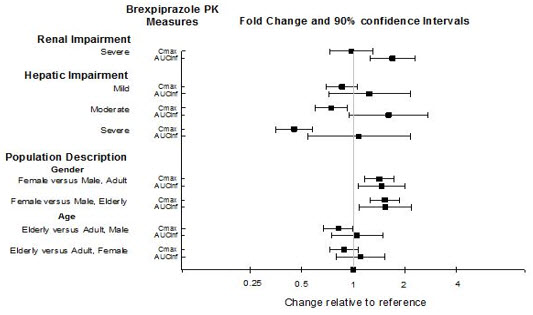
Figure 1 (Rexulti 02)

Figure 1 (Rexulti 02)
A pharmacokinetic (PK) chart showing fold changes and 90% confidence intervals for brexpiprazole under various conditions including renal impairment (severe), hepatic impairment (mild to severe), and population descriptions such as gender and age comparisons. The x-axis represents change relative to reference, and the y-axis lists the conditions, with data points indicating changes in Cmax and AUC values.*
FDA Label Image

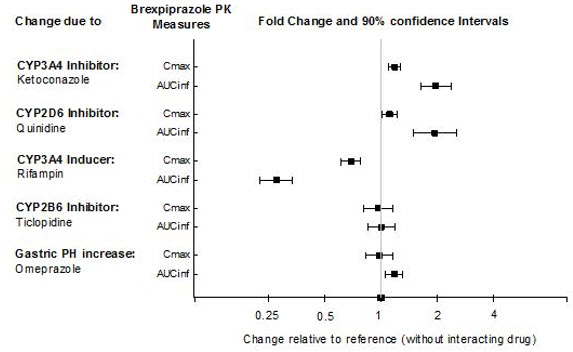
Figure 2 (Rexulti 03)

Figure 2 (Rexulti 03)
A chart showing fold change and 90% confidence intervals for brexpiprazole pharmacokinetic measures Cmax and AUCinf. The chart compares changes relative to a reference without interacting drug under conditions including CYP3A4 inhibitor (ketoconazole), CYP2D6 inhibitor (quinidine), CYP3A4 inducer (rifampin), CYP2B6 inhibitor (ticlopidine), and gastric pH increase (omeprazole). Data points illustrate the effects on Cmax and AUCinf with corresponding confidence intervals.*
FDA Label Image

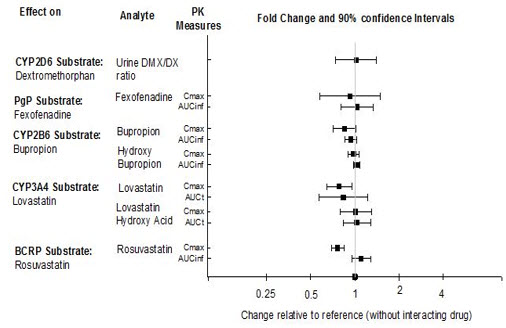
Figure 3 (Rexulti 04)

Figure 3 (Rexulti 04)
A forest plot chart depicting the pharmacokinetic effects of various substrates (CYP2D6, Pgp, CYP2B6, CYP3A4, BCRP substrates) on analytes such as dextromethorphan, fexofenadine, bupropion, lovastatin, and rosuvastatin. The plot shows fold change values with 90% confidence intervals comparing changes relative to a reference without interacting drug, along with specific PK measures like Cmax, AUCinf, and urine DM XDx ratio.*
FDA Label Image

Figure 4 (Rexulti 05)

Figure 4 (Rexulti 05)
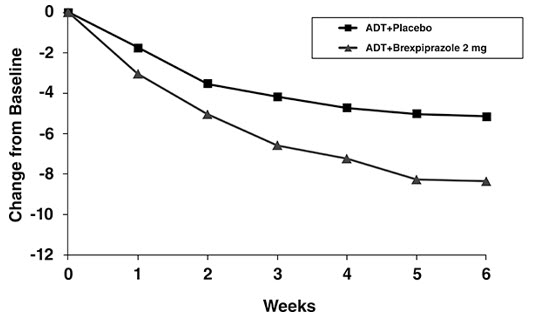
A line graph depicting the change from baseline over six weeks comparing ADT plus Placebo versus ADT plus Brexpiprazole 2 mg. The x-axis represents weeks (0 to 6), and the y-axis shows the change from baseline, with values decreasing from 0 to -12. The graph illustrates that the group receiving Brexpiprazole 2 mg shows a greater negative change from baseline compared to the placebo group over time.*
FDA Label Image

Figure 5 (Rexulti 06)

Figure 5 (Rexulti 06)
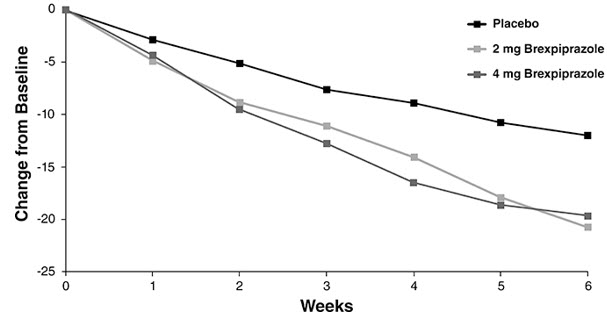
A line graph showing change from baseline over 6 weeks for placebo, 2 mg brexpiprazole, and 4 mg brexpiprazole groups. The Y-axis measures change from baseline and the X-axis represents weeks. Lines indicate decreasing values over time for all groups, with brexpiprazole groups showing greater change than placebo.*
FDA Label Image

Figure 6 (Rexulti 07)

Figure 6 (Rexulti 07)
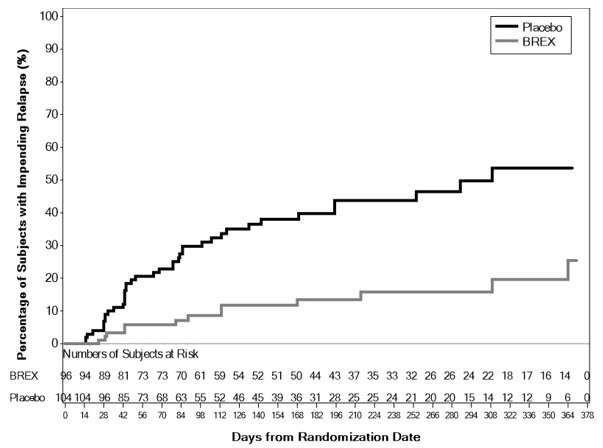
A line graph depicting the percentage of subjects with impending relapse over time, comparing BREX (brexpiprazole) versus placebo. The graph shows two curves, with the placebo group having a higher percentage of subjects experiencing relapse compared to the BREX group. The x-axis represents time in days, while the y-axis represents the percentage of subjects with impending relapse. At the bottom, a table lists the number of subjects at risk for both BREX and placebo groups at different time points.*
FDA Label Image

Figure 7 (Rexulti 08)

Figure 7 (Rexulti 08)
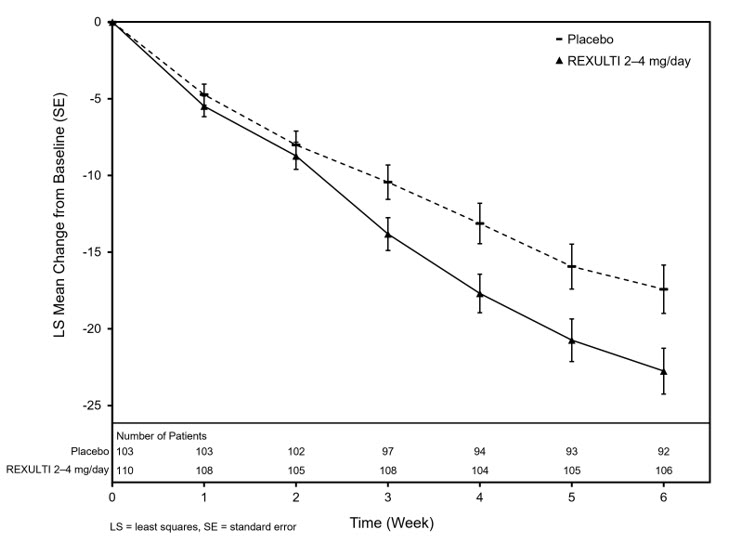
A line graph comparing the least squares mean change from baseline over six weeks between placebo and Rexulti (brexpiprazole) 2-4 mg/day. The x-axis represents time in weeks, and the y-axis represents least squares mean change with standard error bars. Patient numbers for each group at each week are shown below the x-axis.*
FDA Label Image

Figure 8 (Rexulti 09)

Figure 8 (Rexulti 09)
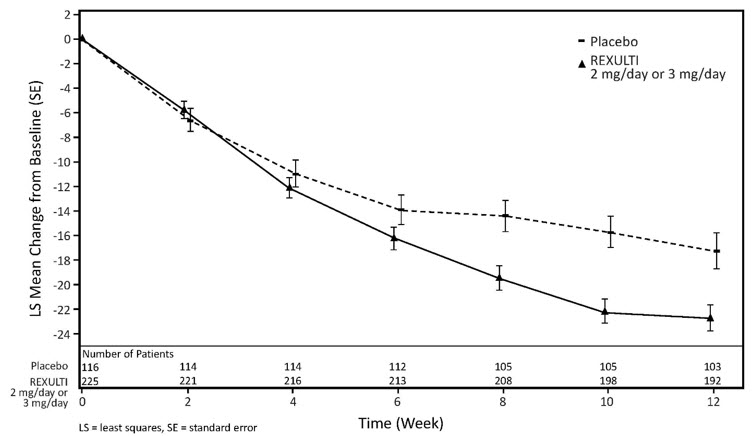
A line graph comparing the least squares mean change from baseline (with standard error) over 12 weeks between Placebo and REXULTI 2 mg/day or 3 mg/day. The x-axis represents time in weeks, and the y-axis shows LS mean change from baseline. Patient numbers for each group are listed below the time intervals.*

* About these descriptions: Image descriptions on this page are generated by automated AI analysis of the product label images from the manufacturer's FDA label submission (SPL). They are provided for reference only and may contain errors or omissions. Always rely on the printed label itself and the official FDA labeling, and consult a pharmacist or healthcare professional with any questions about this product.