Carglumic Acid Tablet, For Suspension
Product Images NDC 71863-114

4 FDA label images from Eton Pharmaceuticals, Inc. · Packaging, Regulatory Labels, and Product Appearance

Product Visual Gallery

This gallery contains 4 technical images submitted to the FDA as part of the official labeling for Carglumic Acid (NDC 71863-114). Unlike standard consumer photos, these assets often include clinical data figures, molecular chemical structures, and official manufacturer packaging layouts.

As provided by Eton Pharmaceuticals, Inc., these visuals offer a comprehensive scientific overview of the product's physical and chemical identity, aiding pharmacists and researchers in product verification and study.

FDA Label Image

Booklet (Booklet)

Booklet (Booklet)
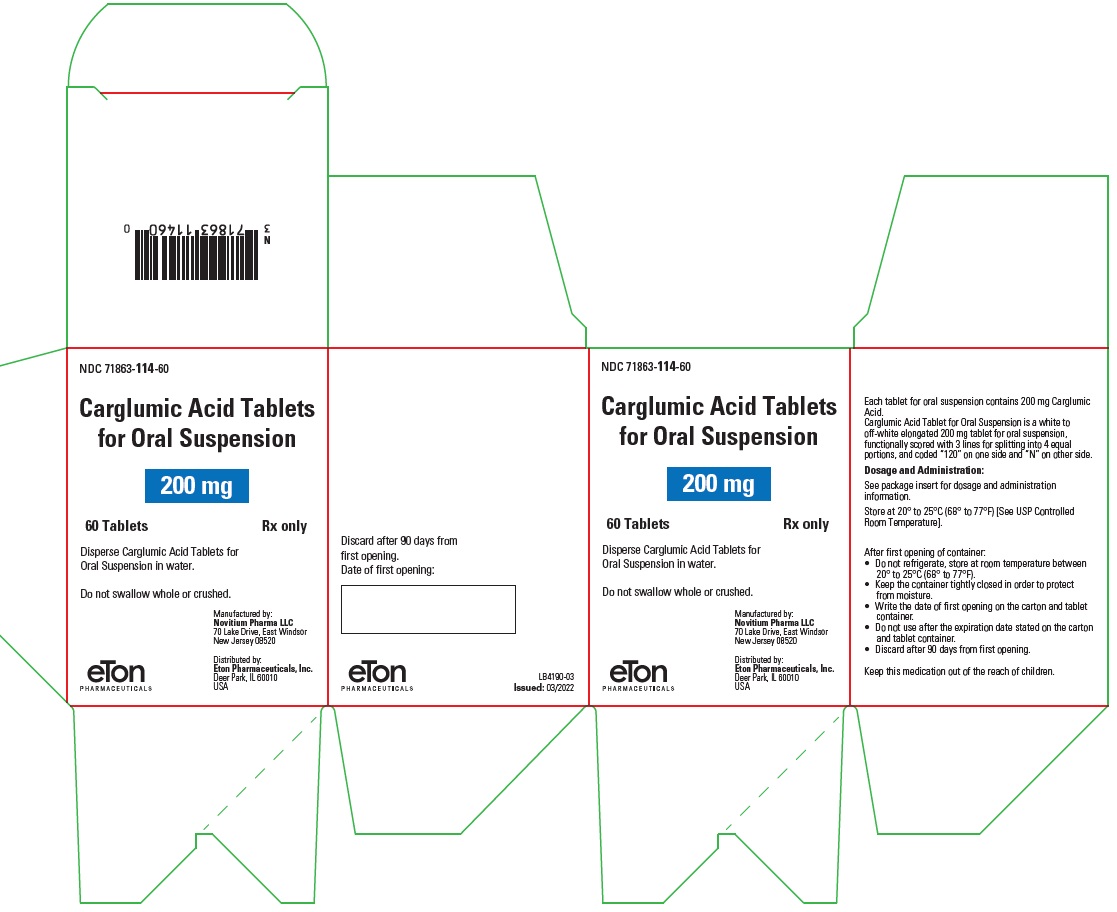
Labels for Carglumic Acid Tablets for Oral Suspension 200 mg, manufactured by Eton Pharmaceuticals, Inc. Each label includes a barcode, NDC 71863-114-60, and states the package contains 60 tablets. Instructions indicate storage at 20° to 25°C (68° to 77°F) and discard 90 days after first opening. Labels feature the eTON Pharmaceuticals logo, lot and expiration date fields, and dosing/storage instructions.*
FDA Label Image

Structure (Carglumic Structure)

Structure (Carglumic Structure)
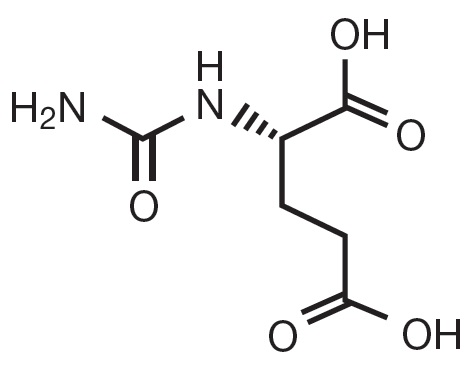
Chemical structure of carglumic acid, showing its molecular arrangement with amino, hydroxyl, and carboxyl functional groups.*
FDA Label Image

Carton (Carton)

Carton (Carton)
Packaging label for Carglumic Acid Tablets for Oral Suspension, 200 mg strength, containing 60 tablets. The product is for prescription use only and is manufactured by Novitium Pharma LLC and distributed by Eton Pharmaceuticals, Inc. The label includes instructions for dispersion in water, storage conditions, and usage warnings.*
FDA Label Image

Figure-1 (Figure 1)

Figure-1 (Figure 1)
Line graph showing NH3 response in evaluable patients (n=13) over a period from baseline to long-term. The y-axis represents mean NH3 levels (µmol/L), and the x-axis shows days including baseline, Day 2, Day 4, Day 5, Day 6, and long-term. The graph indicates a decline in mean NH3 levels from baseline through Day 2, with relatively stable low levels thereafter.*

* About these descriptions: Image descriptions on this page are generated by automated AI analysis of the product label images from the manufacturer's FDA label submission (SPL). They are provided for reference only and may contain errors or omissions. Always rely on the printed label itself and the official FDA labeling, and consult a pharmacist or healthcare professional with any questions about this product.