Myfembree Tablet, Film Coated
Product Images NDC 72974-415

12 FDA label images from Sumitomo Pharma America, Inc · Packaging, Regulatory Labels, and Product Appearance

Product Visual Gallery

This gallery contains 12 technical images submitted to the FDA as part of the official labeling for Myfembree (NDC 72974-415). Unlike standard consumer photos, these assets often include clinical data figures, molecular chemical structures, and official manufacturer packaging layouts.

As provided by Sumitomo Pharma America, Inc, these visuals offer a comprehensive scientific overview of the product's physical and chemical identity, aiding pharmacists and researchers in product verification and study.

FDA Label Image

Figure (Myf00 0010 01)
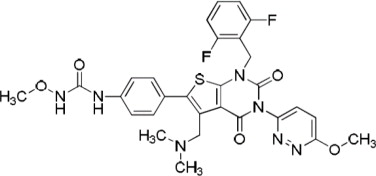
Figure (Myf00 0010 01)
Chemical structure of the active ingredient combination relugolix, estradiol hemihydrate, and norethindrone acetate for the medication Myfembree.*
FDA Label Image

Figure (Myf00 0010 02)

Figure (Myf00 0010 02)
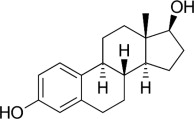
Chemical structure of estradiol hemihydrate, part of the active ingredients in Myfembree oral tablets. The structure shows a steroid nucleus with hydroxyl groups attached, characteristic of estradiol compounds.*
FDA Label Image

Figure (Myf00 0010 03)

Figure (Myf00 0010 03)
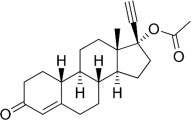
Chemical structure of the active ingredient in Myfembree, showing a complex steroid skeleton with multiple hydrogen and carbon atoms, and functional groups including an ester moiety represented with a double-bonded oxygen and acetate group.*
FDA Label Image

Figure (Myf00 0010 04)

Figure (Myf00 0010 04)
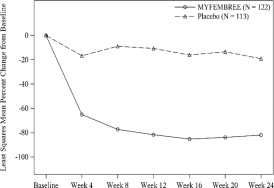
A line graph comparing least squares mean percent change from baseline over 24 weeks between MYFEMBREE and placebo groups in a clinical study. The x-axis represents time points from baseline to week 24, and the y-axis represents percent change. MYFEMBREE group shows a greater decrease compared to placebo throughout the study period.*
FDA Label Image

Figure (Myf00 0010 05)

Figure (Myf00 0010 05)
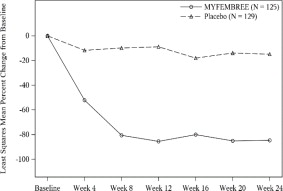
A line graph comparing the least squares mean percent change from baseline in a measured variable over 24 weeks between two groups: Myfembree (N=125) and Placebo (N=129). The x-axis represents time points from baseline to week 24, and the y-axis shows percent change values, with Myfembree showing a steeper and greater decrease compared to placebo.*
FDA Label Image

Figure (Myf00 0010 06)

Figure (Myf00 0010 06)
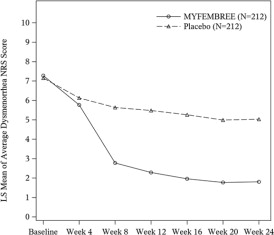
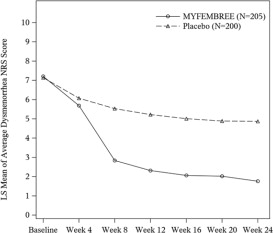
A line graph comparing the LS Mean of average Dysmenorrhea NRS scores over 24 weeks between Myfembree and placebo groups. The x-axis represents time from baseline to week 24, and the y-axis shows the NRS scores from 0 to 10. Myfembree scores decrease significantly over time, whereas placebo scores remain relatively stable.*
FDA Label Image

Figure (Myf00 0010 07)

Figure (Myf00 0010 07)
A line chart comparing the LS Mean of Average Dysmenorrhea NRS Scores over 24 weeks between two groups: Myfembree (N=205) and placebo (N=200). The chart shows a decrease in scores for Myfembree over time, while placebo scores remain relatively steady.*
FDA Label Image

Figure (Myf00 0010 08)

Figure (Myf00 0010 08)
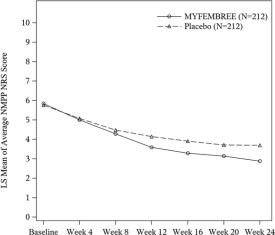
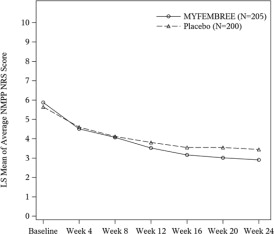
Line graph comparing the Least Squares Mean of Average NMPRS Scores over 24 weeks between Myfembree and placebo groups, each with 212 participants. The graph shows a trend of decreasing pain scores with Myfembree compared to placebo, plotted at baseline and multiple follow-up weeks.*
FDA Label Image

Figure (Myf00 0010 09)

Figure (Myf00 0010 09)
Line graph depicting the LS mean of average NMPR PNS scores over 24 weeks for Myfembree versus placebo groups. The x-axis shows time points from baseline to week 24, while the y-axis shows scores from 0 to 10. The graph compares the decline in scores between the two groups across the study duration.*
FDA Label Image

Figure (Myf00 0010 10)

Figure (Myf00 0010 10)
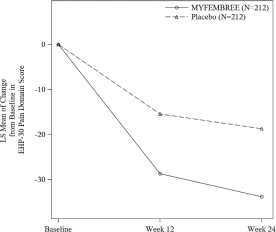
A line graph comparing mean changes from baseline in pelvic pain domain scores of the EHP-30 over 24 weeks between Myfembree (N=212) and placebo (N=212) groups. The graph shows larger reductions in pain scores for the Myfembree group at weeks 12 and 24 compared to placebo.*
FDA Label Image

Figure (Myf00 0010 11)

Figure (Myf00 0010 11)
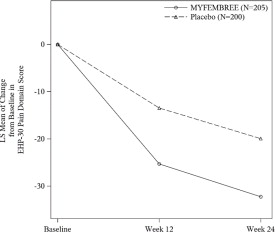
A line graph showing the Least Squares Mean Change from Baseline in EHP-30 Pain Domain Score over time (Baseline, Week 12, Week 24) comparing Myfembree and placebo groups. The chart shows a greater reduction in pain score for the Myfembree group compared to placebo.*
FDA Label Image

Principal Display Panel (28 Tablet Bottle Label)

Principal Display Panel (28 Tablet Bottle Label)
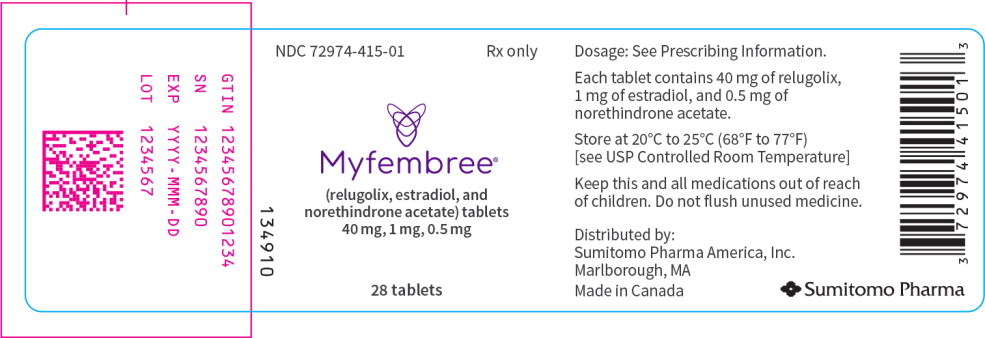
Label for Myfembree tablets containing 40 mg relugolix, 1 mg estradiol, and 0.5 mg norethindrone acetate. The film-coated oral tablets are supplied in a package of 28 tablets. Distributed by Sumitomo Pharma America, Inc., Marlborough, MA. The label includes dosage instructions to see prescribing information and storage conditions at 20°C to 25°C.*

* About these descriptions: Image descriptions on this page are generated by automated AI analysis of the product label images from the manufacturer's FDA label submission (SPL). They are provided for reference only and may contain errors or omissions. Always rely on the printed label itself and the official FDA labeling, and consult a pharmacist or healthcare professional with any questions about this product.