Dutasteride Capsule
Product Images NDC 84091-100

View Photos of Packaging, Regulatory Labels, and Product Appearance

Product Visual Gallery

This gallery contains 9 technical images submitted to the FDA as part of the official labeling for Dutasteride (NDC 84091-100). Unlike standard consumer photos, these assets often include clinical data figures, molecular chemical structures, and official manufacturer packaging layouts.

As provided by Banyan Pharma Llc, these visuals offer a comprehensive scientific overview of the product's physical and chemical identity, aiding pharmacists and researchers in product verification and study.

FDA Label Image

Chemical Structure (Dutasteride 01)

Chemical Structure (Dutasteride 01)
Chemical structure diagram of dutasteride, illustrating the molecular arrangement including trifluoromethyl groups and steroid backbone typical of this active ingredient.*
FDA Label Image

Figure 1 (Dutasteride 02)

Figure 1 (Dutasteride 02)
A line graph depicting the mean change from baseline in AUASI over 24 months of treatment for Dutasteride versus placebo. The x-axis represents months of treatment, and the y-axis shows the mean change from baseline. Dutasteride shows a greater reduction compared to placebo across the period.*
FDA Label Image

Figure 2 (Dutasteride 03)

Figure 2 (Dutasteride 03)
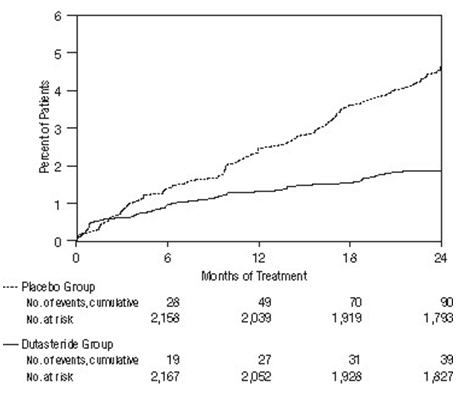
A cumulative event curve chart showing the percent of patients over 24 months of treatment comparing Dutasteride Group (solid line) to Placebo Group (dashed line). The x-axis represents months of treatment, and the y-axis shows percent of patients with events. Tabulated data below the graph indicate cumulative events and number at risk at intervals of 0, 6, 12, 18, and 24 months.*
FDA Label Image

Figure 3 (Dutasteride 04)

Figure 3 (Dutasteride 04)
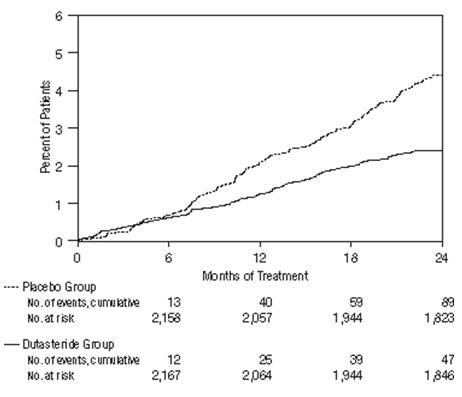
A line graph comparing the cumulative percent of patients over 24 months of treatment in two groups: Placebo and Dutasteride. The x-axis represents months of treatment (0 to 24), and the y-axis shows the percent of patients (0 to 6%). Data tables below the graph list the cumulative number of events and number of patients at risk for each group at various time points.*
FDA Label Image

Figure 4 (Dutasteride 05)

Figure 4 (Dutasteride 05)
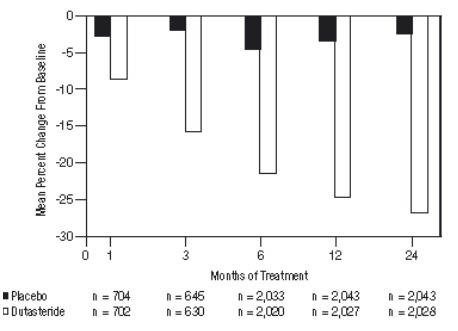
A bar chart depicting mean percent change from baseline over months of treatment (0, 1, 3, 6, 12, and 24) comparing placebo and dutasteride groups. The y-axis shows percent change, with bars for placebo and dutasteride at each time point, and sample sizes listed below the x-axis for each group and time.*
FDA Label Image

Figure 5 (Dutasteride 06)

Figure 5 (Dutasteride 06)
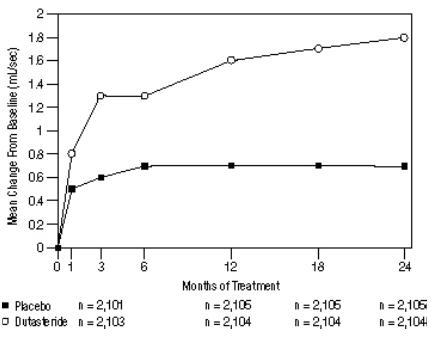
A line graph depicting the mean change from baseline in mL/sec over months of treatment for Dutasteride versus placebo. The x-axis represents months of treatment (0 to 24), and the y-axis represents mean change from baseline (0 to 2.0 mL/sec). Dutasteride shows a greater increase over time compared to placebo.*
FDA Label Image

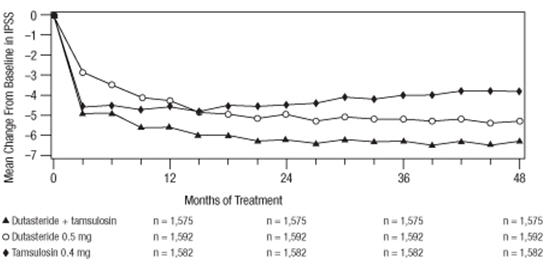
Figure 6 (Dutasteride 07)

Figure 6 (Dutasteride 07)
Line graph depicting mean change from baseline in International Prostate Symptom Score (IPSS) over 48 months of treatment for three groups: Dutasteride with tamsulosin, Dutasteride 0.5 mg, and Tamsulosin 0.4 mg. The x-axis represents months of treatment, and the y-axis shows mean change in IPSS.*
FDA Label Image

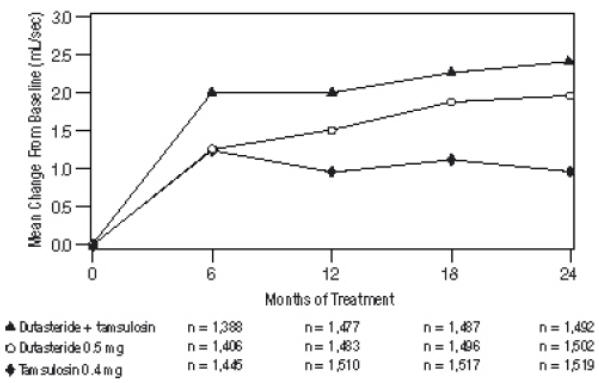
Figure 7 (Dutasteride 08)

Figure 7 (Dutasteride 08)
A line graph depicting mean change from baseline in a variable (IU/sec) over 24 months of treatment for three groups: Dutasteride with tamsulosin, Dutasteride 0.5 mg alone, and Tamsulosin 0.4 mg alone. The x-axis shows months of treatment (0 to 24), and the y-axis shows mean change from baseline (0 to 3.0). Group sizes at each time point are also indicated below the x-axis.*
FDA Label Image

Principal Display Panel (90 Capsule Bottle Carton)

Principal Display Panel (90 Capsule Bottle Carton)
Label for Dutasteride Capsules, USP 0.5 mg by Banyan Pharma LLC. The label details usage instructions, storage conditions, and a warning that Dutasteride should not be used by women or children. The package contains 90 softgel capsules. The drug is distributed by Banyan Pharma LLC in Hoboken, NJ and made in India.*

* About these descriptions: Image descriptions on this page are generated by automated AI analysis of the product label images from the manufacturer's FDA label submission (SPL). They are provided for reference only and may contain errors or omissions. Always rely on the printed label itself and the official FDA labeling, and consult a pharmacist or healthcare professional with any questions about this product.