Botox Injection, Powder, Lyophilized, For Solution
Product Images NDC 85766-155

View Photos of Packaging, Regulatory Labels, and Product Appearance

Product Visual Gallery

This gallery contains 20 technical images submitted to the FDA as part of the official labeling for Botox (NDC 85766-155). Unlike standard consumer photos, these assets often include clinical data figures, molecular chemical structures, and official manufacturer packaging layouts.

As provided by Sportpharm Llc, these visuals offer a comprehensive scientific overview of the product's physical and chemical identity, aiding pharmacists and researchers in product verification and study.

FDA Label Image

Figure 1: Injection Pattern For Intradetrusor Injections For Treatment Of Overactive Bladder And Detrusor Overactivity Associated With A Neurologic Condition (Botox 01)
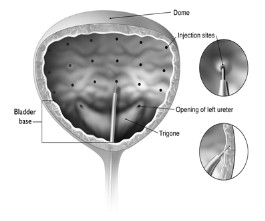
Figure 1:	Injection Pattern For Intradetrusor Injections For Treatment Of Overactive Bladder And Detrusor Overactivity Associated With A Neurologic Condition (Botox 01)
An anatomical diagram showing a cross-section of the bladder interior with labeled injection sites for treatment. The illustration points to the dome, trigone, bladder base, and opening of the left ureter, with close-up views of an injection site and needle positioning within the bladder wall.*
FDA Label Image
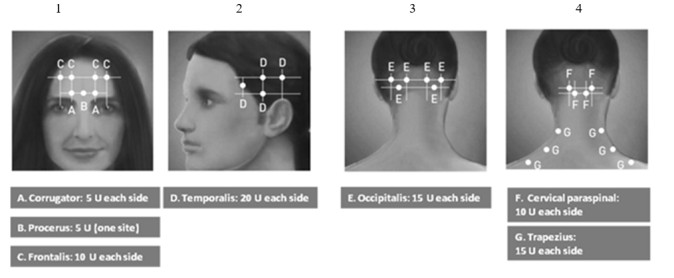
Diagrams 1-4: Recommended Injection Sites (a Through G) For Chronic Migraine (Botox 02)
An anatomical diagram illustrating injection sites for BOTOX (onabotulinumtoxinA) intramuscular administration. It shows labeled points on the forehead, temples, back of the head, and neck with corresponding muscle names and unit dosages for each injection site, including Corrugator, Procerus, Frontalis, Temporalis, Occipitalis, Cervical paraspinal, and Trapezius muscles.*
FDA Label Image

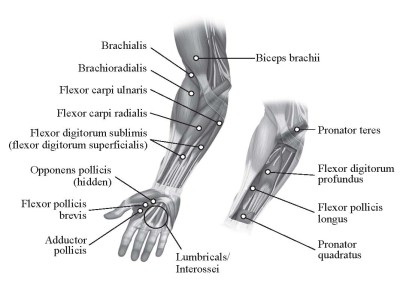
A Close Up Of A Piece Of Paperdescription Automatically Generated (Botox 03)

A Close Up Of A Piece Of Paperdescription Automatically Generated (Botox 03)
An anatomical illustration of the human forearm and hand muscles labeling major muscle groups including brachialis, brachioradialis, flexor carpi ulnaris, flexor carpi radialis, flexor digitorum sublimis, flexor digitorum profundus, pronator teres, pronator quadratus, flexor pollicis brevis, flexor pollicis longus, opponens pollicis, adductor pollicis, lumbricals/interossei, and biceps brachii.*
FDA Label Image

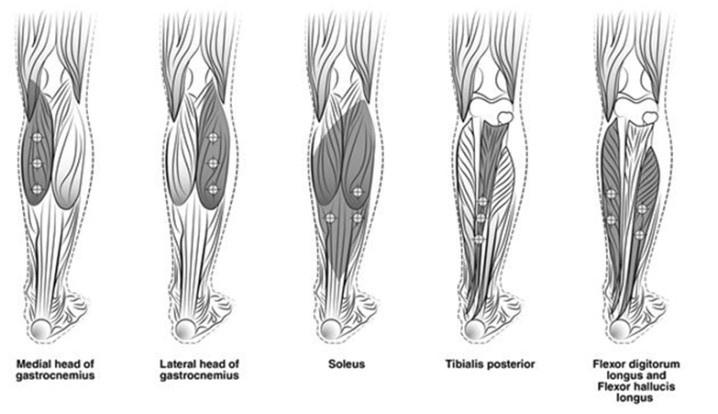
Figure 3: Injection Sites For Adult Lower Limb Spasticity (Botox 04)

Figure 3: Injection Sites For Adult Lower Limb Spasticity (Botox 04)
An anatomical illustration showing the muscles of the lower leg from a posterior view. It highlights the medial and lateral heads of the gastrocnemius, soleus, tibialis posterior, and the flexor digitorum longus with flexor hallucis longus muscles. Each muscle is shaded and labeled to depict their locations and structure within the lower leg.*
FDA Label Image

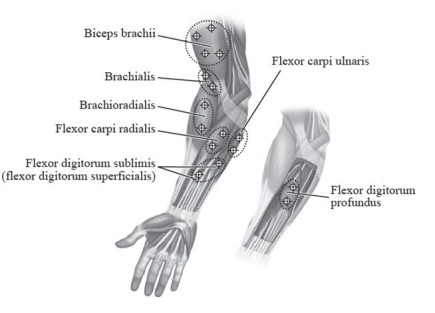
Figure 4: Injection Sites For Pediatric Upper Limb Spasticity (Botox 05)

Figure 4: Injection Sites For Pediatric Upper Limb Spasticity (Botox 05)
An anatomical illustration showing muscles of the human forearm and hand. Muscles labeled include Biceps brachii, Brachialis, Brachioradialis, Flexor carpi radialis, Flexor digitorum sublimis (flexor digitorum superficialis), Flexor carpi ulnaris, and Flexor digitorum profundus. The illustration highlights muscle groups relevant for intramuscular or intradermal injection sites.*
FDA Label Image

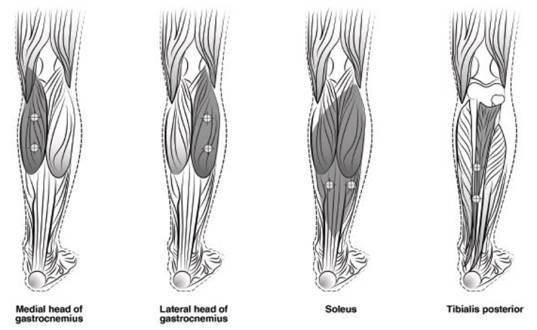
Figure 5 (Botox 06)

Figure 5 (Botox 06)
Illustration showing intramuscular injection sites on the lower leg muscles for BOTOX (onabotulinumtoxinA). The diagram highlights the medial and lateral heads of the gastrocnemius, soleus, and tibialis posterior muscles with specific injection points indicated on each muscle group.*
FDA Label Image

Figure 6: Injection Pattern For Primary Axillary Hyperhidrosis (Botox 07)

Figure 6: Injection Pattern For Primary Axillary Hyperhidrosis (Botox 07)
Illustration depicting a cross-sectional view of a nerve bundle, showing multiple nerve fibers surrounded by connective tissue. This diagram is relevant for understanding the anatomical context of onabotulinumtoxinA injection sites.*
FDA Label Image

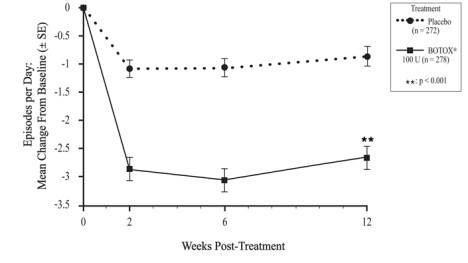
Figure 7: Mean Change From Baseline In Daily Frequency Of Urinary Incontinence Episodes Following Intradetrusor Injection In Study Oab-1 (Botox 08)

Figure 7: Mean Change From Baseline In Daily Frequency Of Urinary Incontinence Episodes Following Intradetrusor Injection In Study Oab-1 (Botox 08)
A line graph comparing episodes per day mean change from baseline over 12 weeks post-treatment between BOTOX 100 U and placebo groups. The graph shows a significant decrease in episodes for the BOTOX group compared to placebo, with error bars and a statistical significance marker (p < 0.001) at 12 weeks.*
FDA Label Image

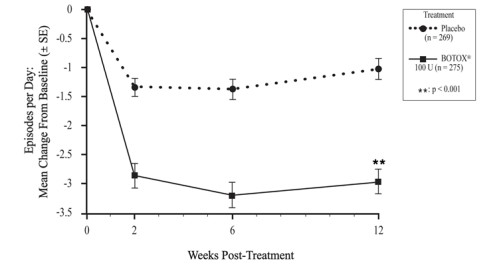
Figure 8: Mean Change From Baseline In Daily Frequency Of Urinary Incontinence Episodes Following Intradetrusor Injection In Study Oab-2 (Botox 09)

Figure 8: Mean Change From Baseline In Daily Frequency Of Urinary Incontinence Episodes Following Intradetrusor Injection In Study Oab-2 (Botox 09)
A line graph comparing the mean change from baseline in episodes per day over 12 weeks post-treatment between BOTOX 100 U and placebo groups. The x-axis shows weeks post-treatment (0, 2, 6, 12) and the y-axis shows mean change in episodes per day with standard error bars. The BOTOX group shows a larger decrease in episodes compared to placebo, with a statistically significant difference at week 12.*
FDA Label Image

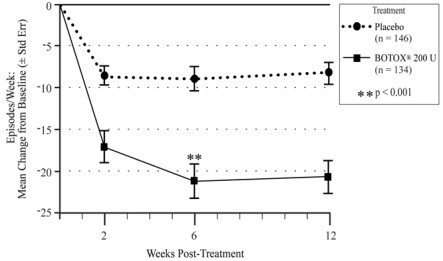
Figure 9: Mean Change From Baseline In Weekly Frequency Of Urinary Incontinence Episodes During Treatment Cycle 1 In Study Ndo-1 (Botox 0a)

Figure 9: Mean Change From Baseline In Weekly Frequency Of Urinary Incontinence Episodes During Treatment Cycle 1 In Study Ndo-1 (Botox 0a)
This line graph compares the mean change from baseline in episodes per week with standard error over 12 weeks post-treatment between placebo and BOTOX 200 units. The plot shows statistically significant reductions in episodes for BOTOX compared to placebo at week 6 (P < 0.001).*
FDA Label Image

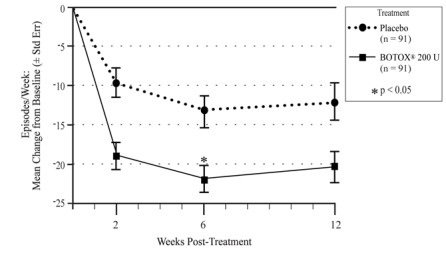
Figure 10: Mean Change From Baseline In Weekly Frequency Of Urinary Incontinence Episodes During Treatment Cycle 1 In Study Ndo-2 (Botox 0b)

Figure 10: Mean Change From Baseline In Weekly Frequency Of Urinary Incontinence Episodes During Treatment Cycle 1 In Study Ndo-2 (Botox 0b)
Line graph depicting the mean change in episodes per week from baseline with standard error over 12 weeks post-treatment. It compares two treatments: Placebo and BOTOX 200 U, showing a greater reduction in episodes for the BOTOX group. Statistical significance (p < 0.05) is indicated at week 6.*
FDA Label Image

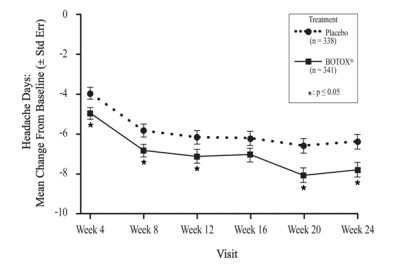
Figure 11: Mean Change From Baseline In Number Of Headache Days For Study 1 (Botox 0c)

Figure 11: Mean Change From Baseline In Number Of Headache Days For Study 1 (Botox 0c)
A line graph comparing mean change from baseline in headache days over 24 weeks for patients treated with BOTOX (onabotulinumtoxinA) versus placebo. The graph shows visits at weeks 4, 8, 12, 16, 20, and 24, with BOTOX consistently resulting in a greater reduction in headache days, marked by statistical significance at multiple points.*
FDA Label Image

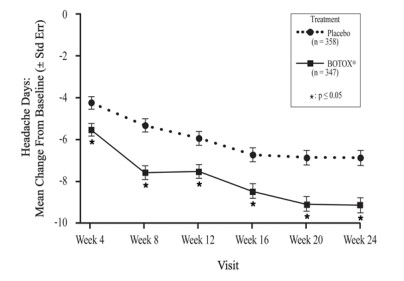
Figure 12: Mean Change From Baseline In Number Of Headache Days For Study 2 (Botox 0d)

Figure 12: Mean Change From Baseline In Number Of Headache Days For Study 2 (Botox 0d)
A line graph depicting mean change from baseline in headache days over 24 weeks for two groups: placebo and BOTOX. The x-axis represents visit weeks (4 to 24), and the y-axis shows headache days mean change. BOTOX consistently shows greater reduction in headache days compared to placebo, with statistical significance at several time points marked by asterisks.*
FDA Label Image

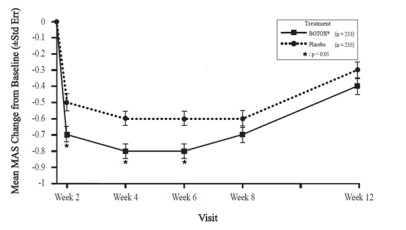
Figure 13: Modified Ashworth Scale Ankle Score For Study 6 – Mean Change From Baseline By Visit (Botox 0e)

Figure 13: Modified Ashworth Scale Ankle Score For Study 6 – Mean Change From Baseline By Visit (Botox 0e)
A line graph depicting the mean MAS (Modified Ashworth Scale) change from baseline over time in weeks for BOTOX injection (100 USP Units) versus placebo. The x-axis shows visits from week 2 to week 12, and the y-axis shows mean MAS change. The graph includes error bars and indicates statistically significant differences at certain time points.*
FDA Label Image

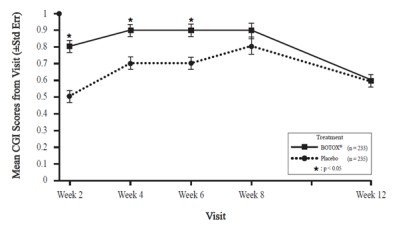
Figure 14: Clinical Global Impression By Physician For Study 6 – Mean Scores By Visit (Botox 0f)

Figure 14: Clinical Global Impression By Physician For Study 6 – Mean Scores By Visit (Botox 0f)
A line graph comparing mean CGI scores from baseline over visits at Weeks 2, 4, 6, 8, and 12 between treatment with BOTOX (onabotulinumtoxinA) and placebo. The graph shows higher scores for BOTOX across visits with statistical significance indicated by asterisks at Weeks 2, 4, 6, and 8.*
FDA Label Image

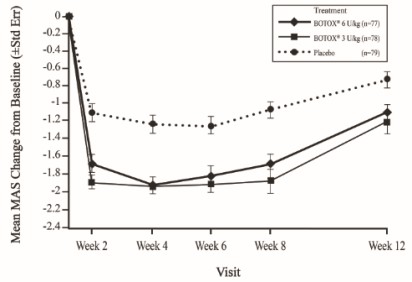
Figure 15: Modified Ashworth Scale Score For Study 1 (pediatric Upper Limb Spasticity, Modified Intent-to-treat Population) – Mean Change From Baseline By Visit (Botox 10)

Figure 15: Modified Ashworth Scale Score For Study 1 (pediatric Upper Limb Spasticity, Modified Intent-to-treat Population) – Mean Change From Baseline By Visit (Botox 10)
A line graph depicting mean changes from baseline in MAS scores over a 12-week period with weekly visits. It compares treatment groups receiving 6 U/kg and 3 U/kg doses of BOTOX and a placebo group, showing trends in effectiveness across time points with error bars for standard error.*
FDA Label Image

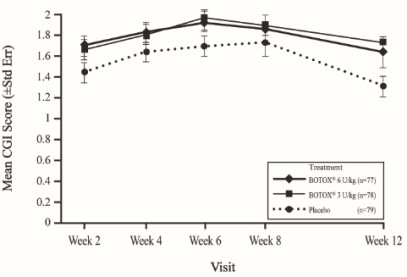
Figure 16: Clinical Global Impression Of Overall Change For Study 1 (pediatric Upper Limb Spasticity, Modified Intent-to-treat Population) – Mean Scores By Visit (Botox 11)

Figure 16: Clinical Global Impression Of Overall Change For Study 1 (pediatric Upper Limb Spasticity, Modified Intent-to-treat Population) – Mean Scores By Visit (Botox 11)
A line graph displaying the mean CGI (Clinical Global Impression) score with standard error over weeks 2, 4, 6, 8, and 12. The graph compares three treatments: BOTOX 6 Units (n=77), BOTOX 3 Units (n=78), and placebo (n=79). The y-axis shows the mean CGI score, and the x-axis shows the visit weeks. BOTOX treatments show higher mean scores compared to placebo throughout the visits.*
FDA Label Image

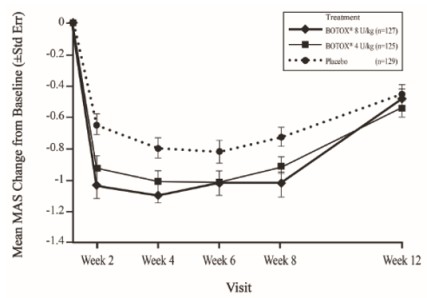
Figure 17: Modified Ashworth Scale Ankle Score For Study 2 (pediatric Lower Limb Spasticity, Modified Intent-to-treat Population) – Mean Change From Baseline By Visit (Botox 12)

Figure 17: Modified Ashworth Scale Ankle Score For Study 2 (pediatric Lower Limb Spasticity, Modified Intent-to-treat Population) – Mean Change From Baseline By Visit (Botox 12)
A line graph showing mean MAS change from baseline over a 12-week visit period comparing three treatments: BOTOX 8 U/kg, BOTOX 4 U/kg, and placebo. Data points with error bars represent the mean changes at weeks 2, 4, 6, 8, and 12, illustrating trends in treatment effects over time.*
FDA Label Image

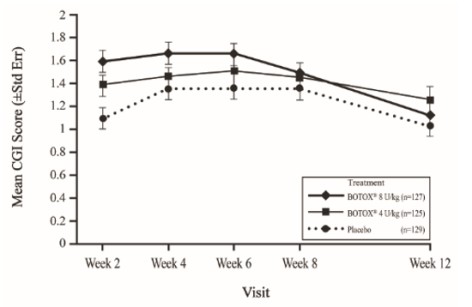
Figure 18: Clinical Global Impression Of Overall Change For Study 2 (pediatric Lower Limb Spasticity, Modified Intent-to-treat Population) – Mean Scores By Visit (Botox 13)

Figure 18: Clinical Global Impression Of Overall Change For Study 2 (pediatric Lower Limb Spasticity, Modified Intent-to-treat Population) – Mean Scores By Visit (Botox 13)
A line graph showing the mean CGI score over time (in weeks) for three groups: BOTOX 8 U/kg, BOTOX 4 U/kg, and placebo. The x-axis represents visit weeks from 2 to 12, while the y-axis shows the mean CGI score with standard error bars, ranging from 0.6 to 2.*
FDA Label Image

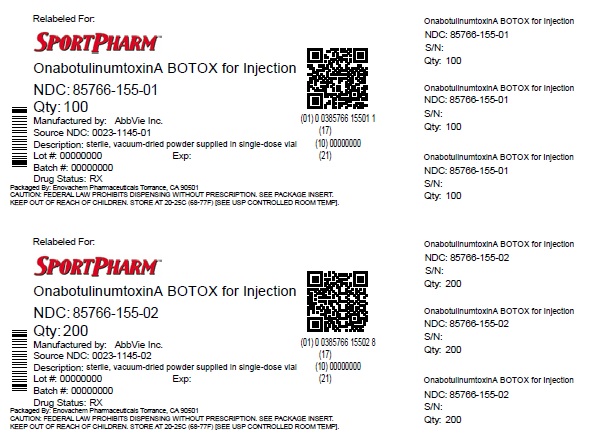
1 (Label)

1 (Label)
Two packaging labels for OnabotulinumtoxinA BOTOX for Injection by Sportpharm LLC. One label is for NDC 85766-155-01 with a quantity of 100, and the other for NDC 85766-155-02 with a quantity of 200. Both list Abbott Inc. as the manufacturer, note the product is sterile vacuum-dried powder for injection, and include storage instructions and batch/lot information placeholders.*

* About these descriptions: Image descriptions on this page are generated by automated AI analysis of the product label images from the manufacturer's FDA label submission (SPL). They are provided for reference only and may contain errors or omissions. Always rely on the printed label itself and the official FDA labeling, and consult a pharmacist or healthcare professional with any questions about this product.