Lofexidine Tablet, Film Coated
Product Images NDC 85789-901

View Photos of Packaging, Regulatory Labels, and Product Appearance

Product Visual Gallery

This gallery contains 7 technical images submitted to the FDA as part of the official labeling for Lofexidine (NDC 85789-901). Unlike standard consumer photos, these assets often include clinical data figures, molecular chemical structures, and official manufacturer packaging layouts.

As provided by Biocorrx Pharmaceuticals Inc, these visuals offer a comprehensive scientific overview of the product's physical and chemical identity, aiding pharmacists and researchers in product verification and study.

FDA Label Image

Bottle Label (Bottlelabel96)
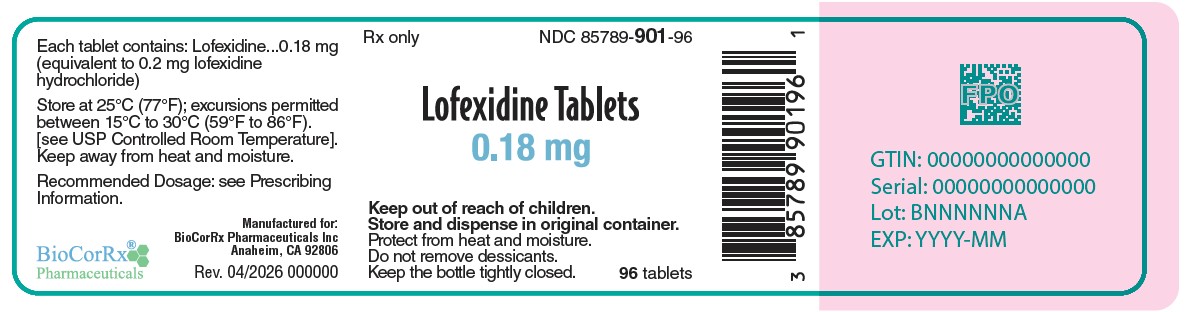
Bottle Label (Bottlelabel96)
Label for Lofexidine Tablets 0.18 mg film-coated oral tablets. The label states each tablet contains 0.18 mg lofexidine (equivalent to 0.2 mg lofexidine hydrochloride). It includes storage instructions at 25°C with allowable excursions, and warnings to keep out of reach of children and protect from heat and moisture. The label also shows the manufacturer as BioCorRx Pharmaceuticals Inc, and a package count of 96 tablets. Bar code, NDC 85789-901, and placeholder fields for GTIN, serial, lot, and expiration date are visible.*
FDA Label Image

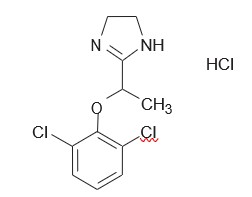
Chemical Structure (Chemicalstructure)

Chemical Structure (Chemicalstructure)
Chemical structure of lofexidine hydrochloride, showing its molecular arrangement including a dichlorophenyl group attached to an oxygen and an imidazoline ring with a methyl group, along with the hydrochloride component.*
FDA Label Image

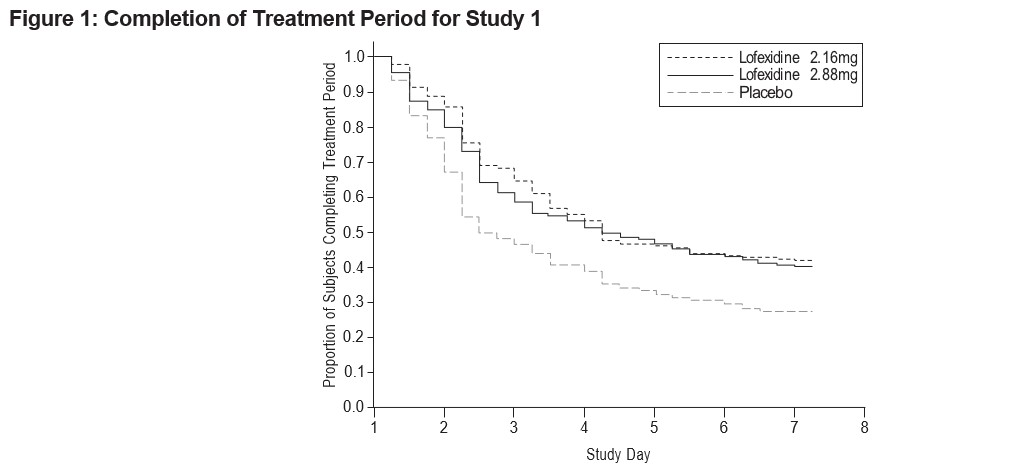
Figure 1 (Figure1)

Figure 1 (Figure1)
A line graph titled 'Completion of Treatment Period for Study 1' showing the proportion of subjects completing treatment over an 8-day study period. The graph compares three groups: Lofexidine 2.16 mg, Lofexidine 2.88 mg, and Placebo, with the y-axis representing the proportion of subjects completing treatment and the x-axis representing the study days.*
FDA Label Image

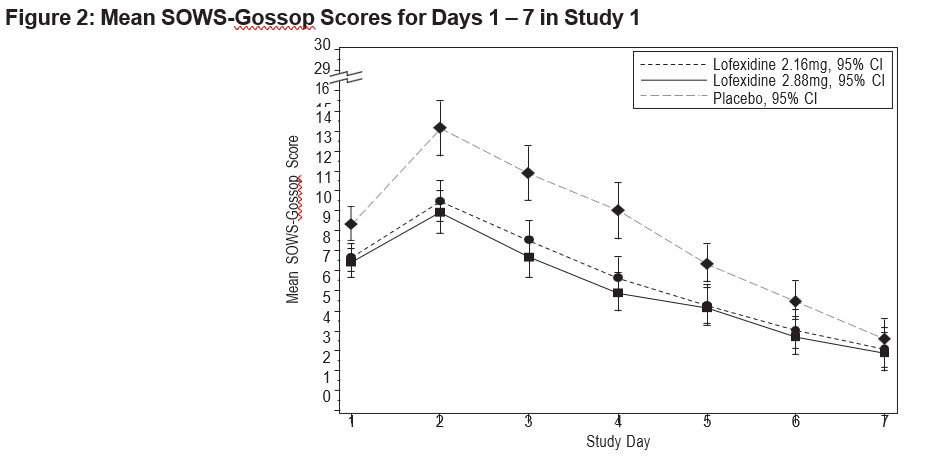
Figure 2 (Figure2)

Figure 2 (Figure2)
A line graph titled 'Mean SOWS-Gossop Scores for Days 1-7 in Study 1' depicting mean SOWS-Gossop scores over a 7-day study period. The x-axis represents study days 1 through 7, and the y-axis represents the mean SOWS-Gossop score ranging from 0 to 30. Three lines show mean scores for Lofexidine 2.16 mg, Lofexidine 2.88 mg, and placebo groups with 95% confidence intervals indicated by error bars.*
FDA Label Image

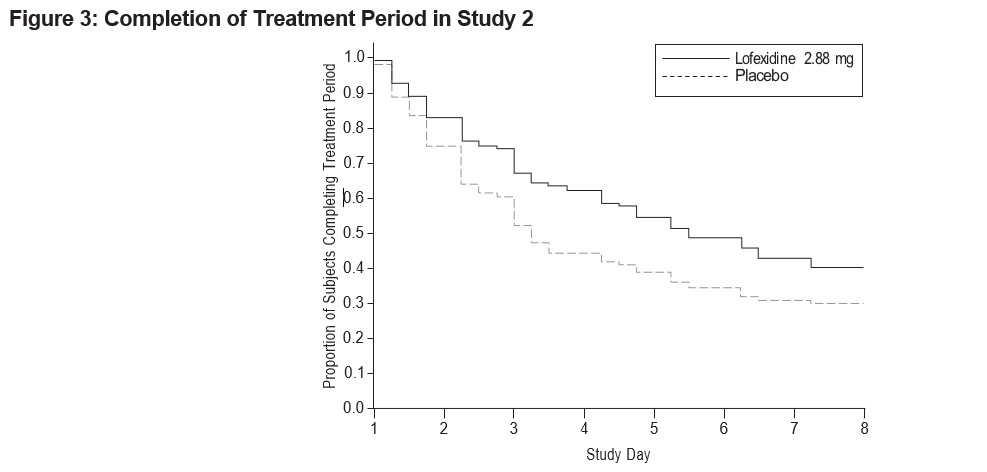
Figure 3 (Figure3)

Figure 3 (Figure3)
A Kaplan-Meier plot showing the completion of the treatment period in Study 2 comparing Lofexidine 2.88 mg with placebo. The vertical axis represents the proportion of subjects completing the treatment period, and the horizontal axis shows study days from 1 to 8. The graph indicates a higher completion proportion for Lofexidine compared to placebo over time.*
FDA Label Image

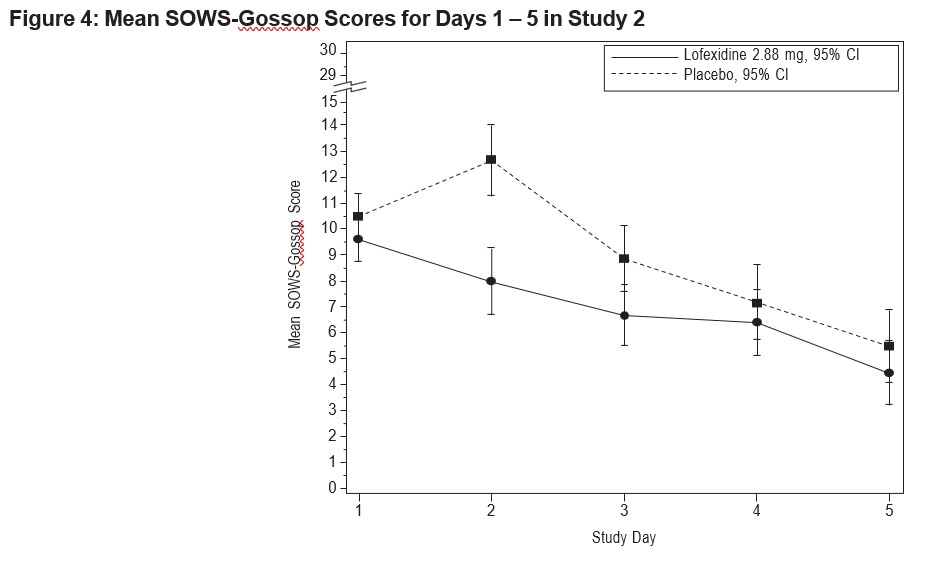
Figure 4 (Figure4)

Figure 4 (Figure4)
A line chart titled 'Mean SOWS-Gossop Scores for Days 1-5 in Study 2' comparing lofexidine 2.88 mg and placebo. The y-axis represents mean SOWS-Gossop scores, and the x-axis shows study days from 1 to 5. The chart displays decreasing scores over the days for both treatments, with lofexidine scores consistently lower than placebo, including 95% confidence intervals.*
FDA Label Image

* About these descriptions: Image descriptions on this page are generated by automated AI analysis of the product label images from the manufacturer's FDA label submission (SPL). They are provided for reference only and may contain errors or omissions. Always rely on the printed label itself and the official FDA labeling, and consult a pharmacist or healthcare professional with any questions about this product.