Graph 1 (Graph 1)
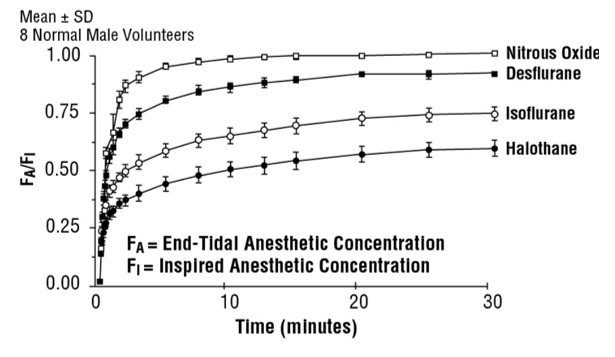
This appears to be a table or graph showing the mean and standard deviation for different anesthetic concentrations administered to eight male volunteers, specifically nitrous oxide, desflurane, isoflurane, and halothane. The graph also displays end-tidal anesthetic concentration and inspired anesthetic concentration over time in minutes.*